This gallery presents statewide, depth-resolved maps that animate through standard soil intervals (see list below). Each GIF cycles from surface to subsoil, making it easy to see how properties change with depth and across landscapes.
Applied Relevance
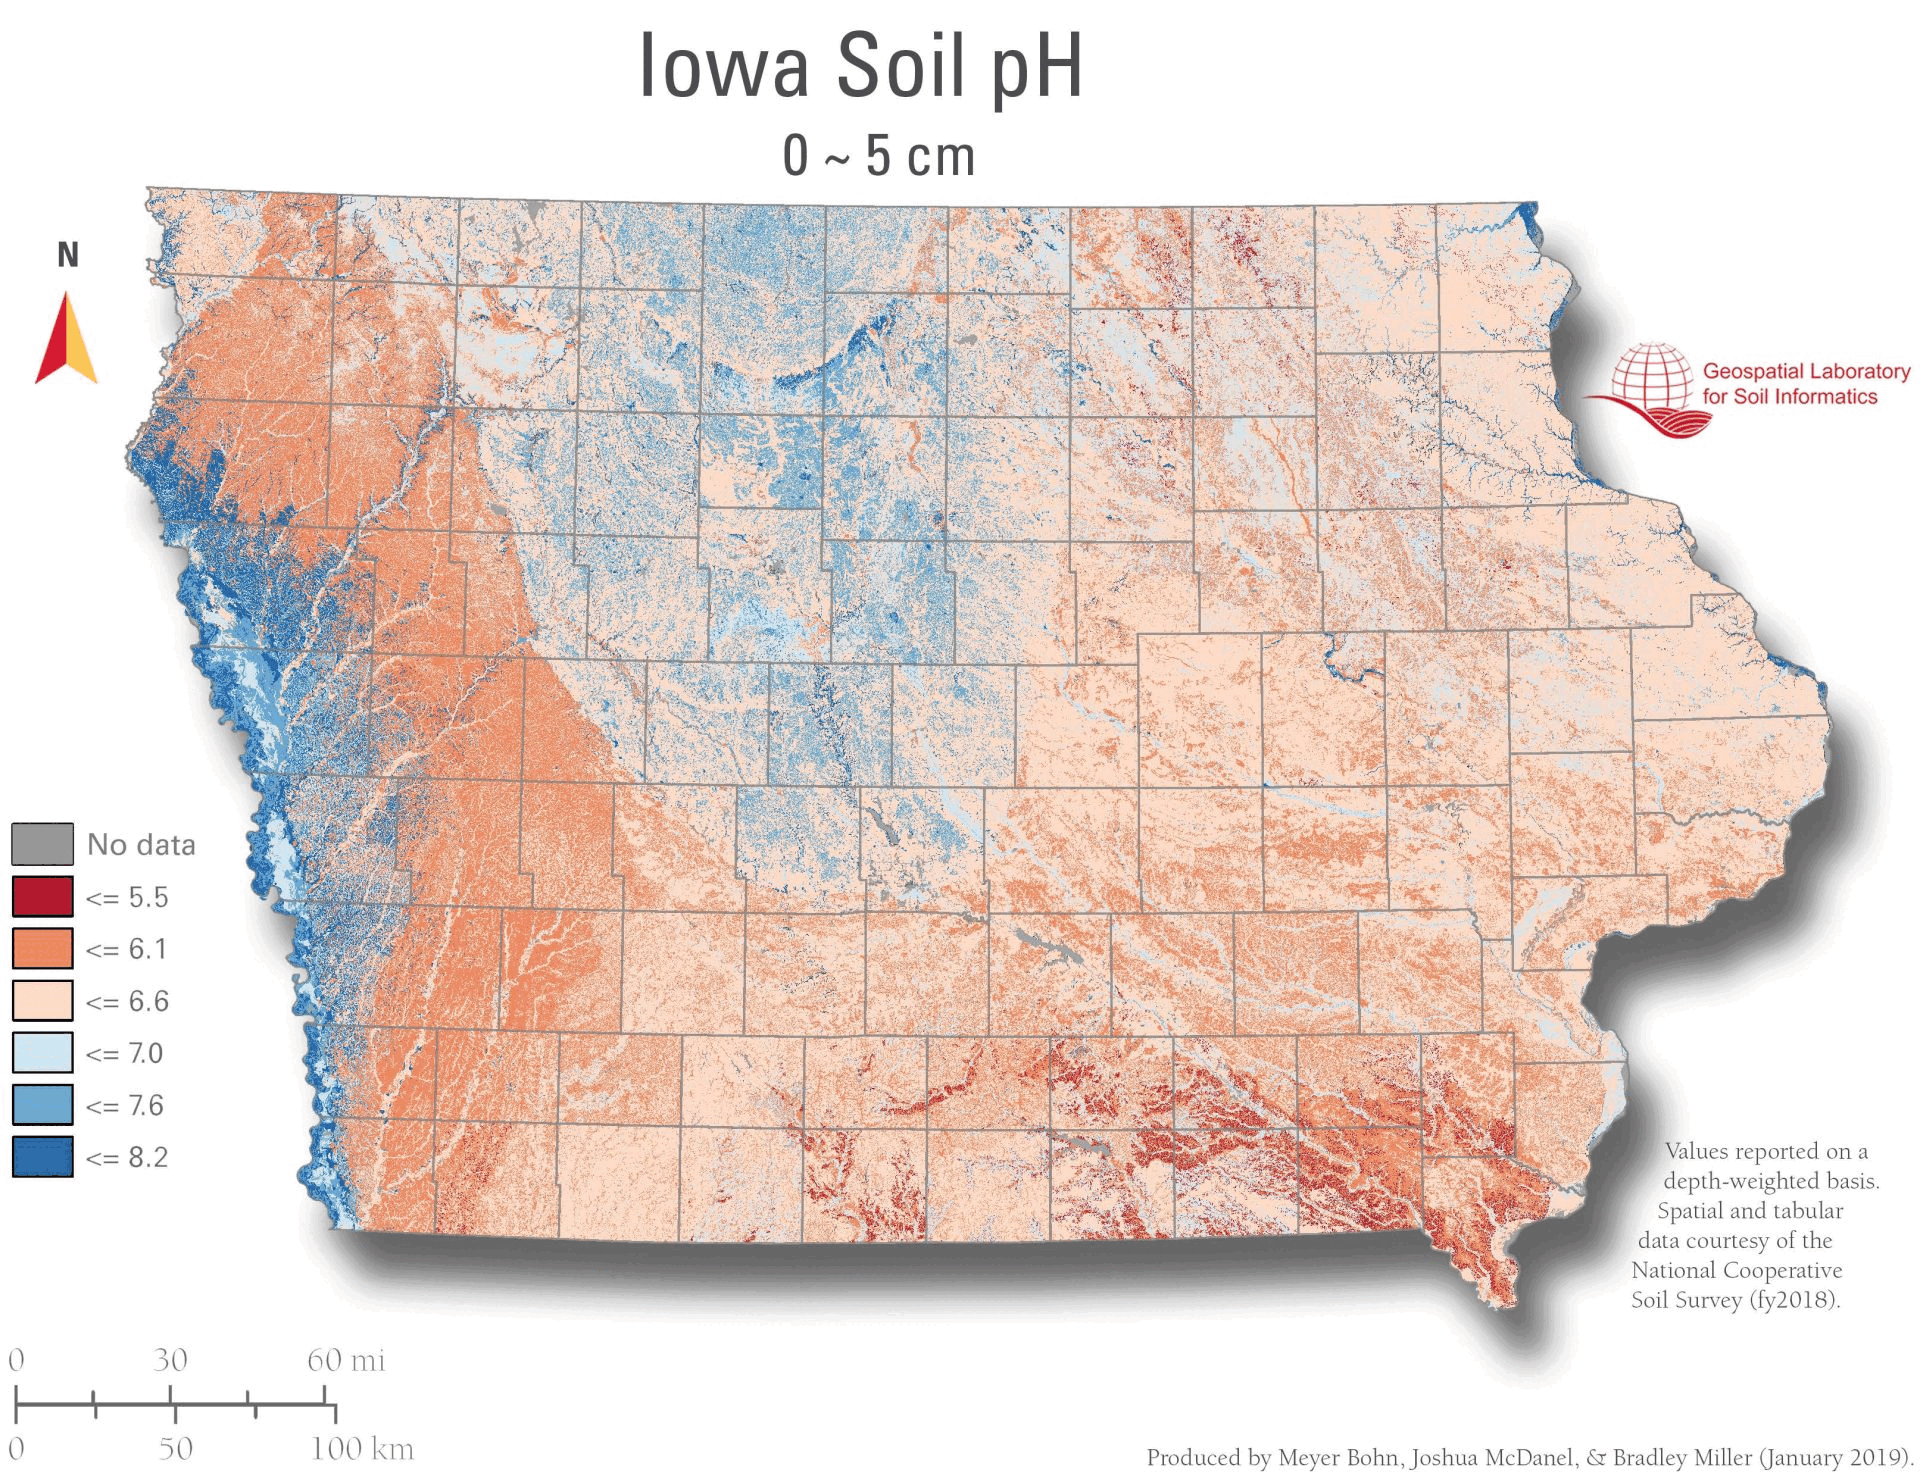
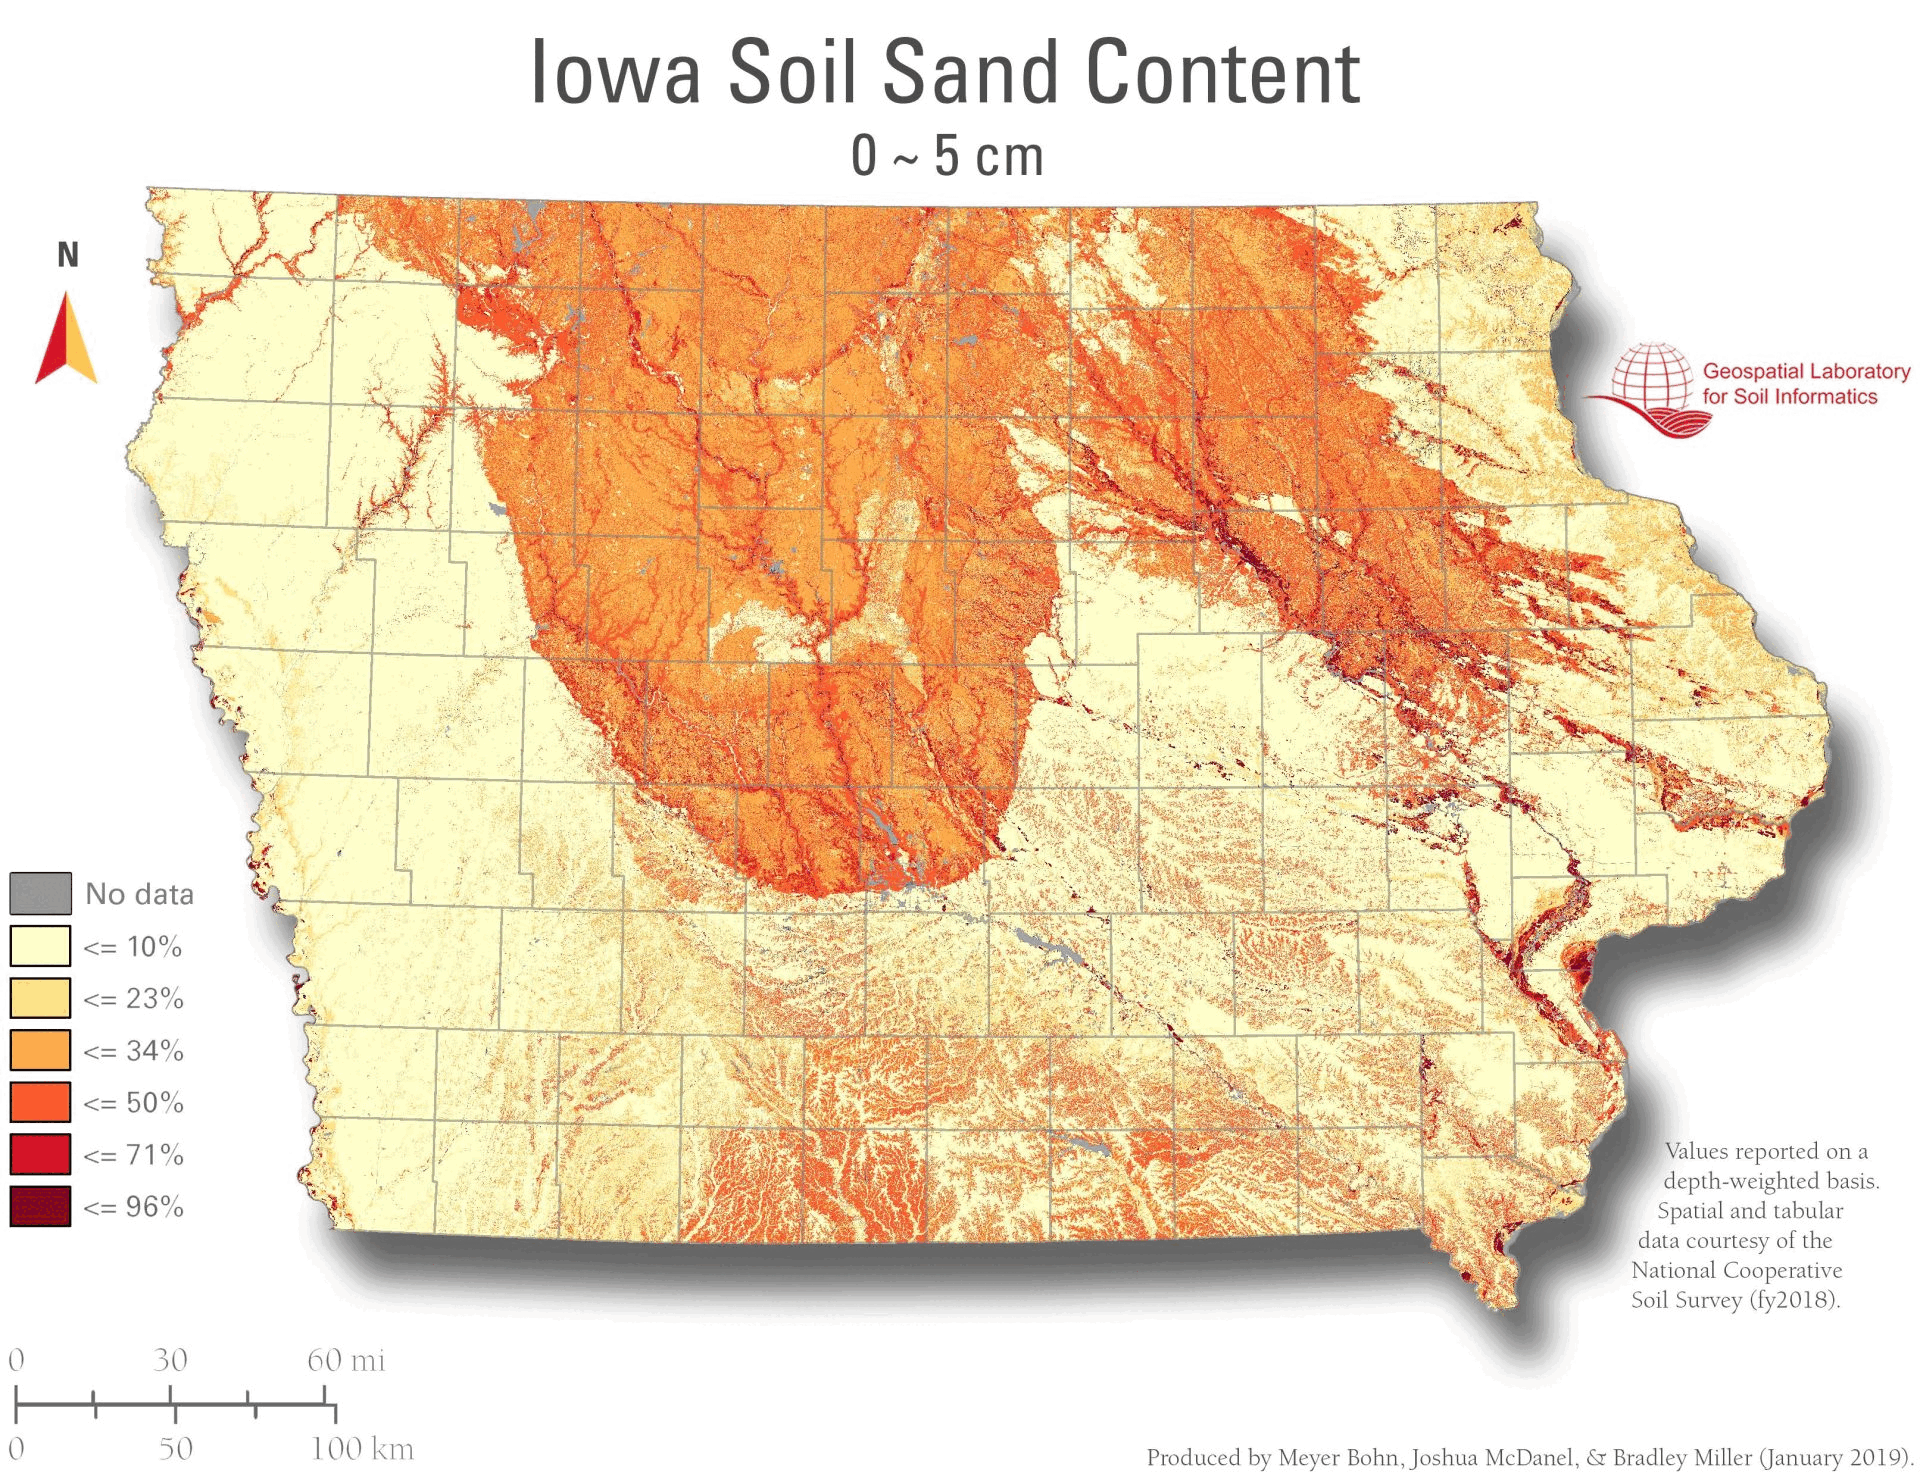
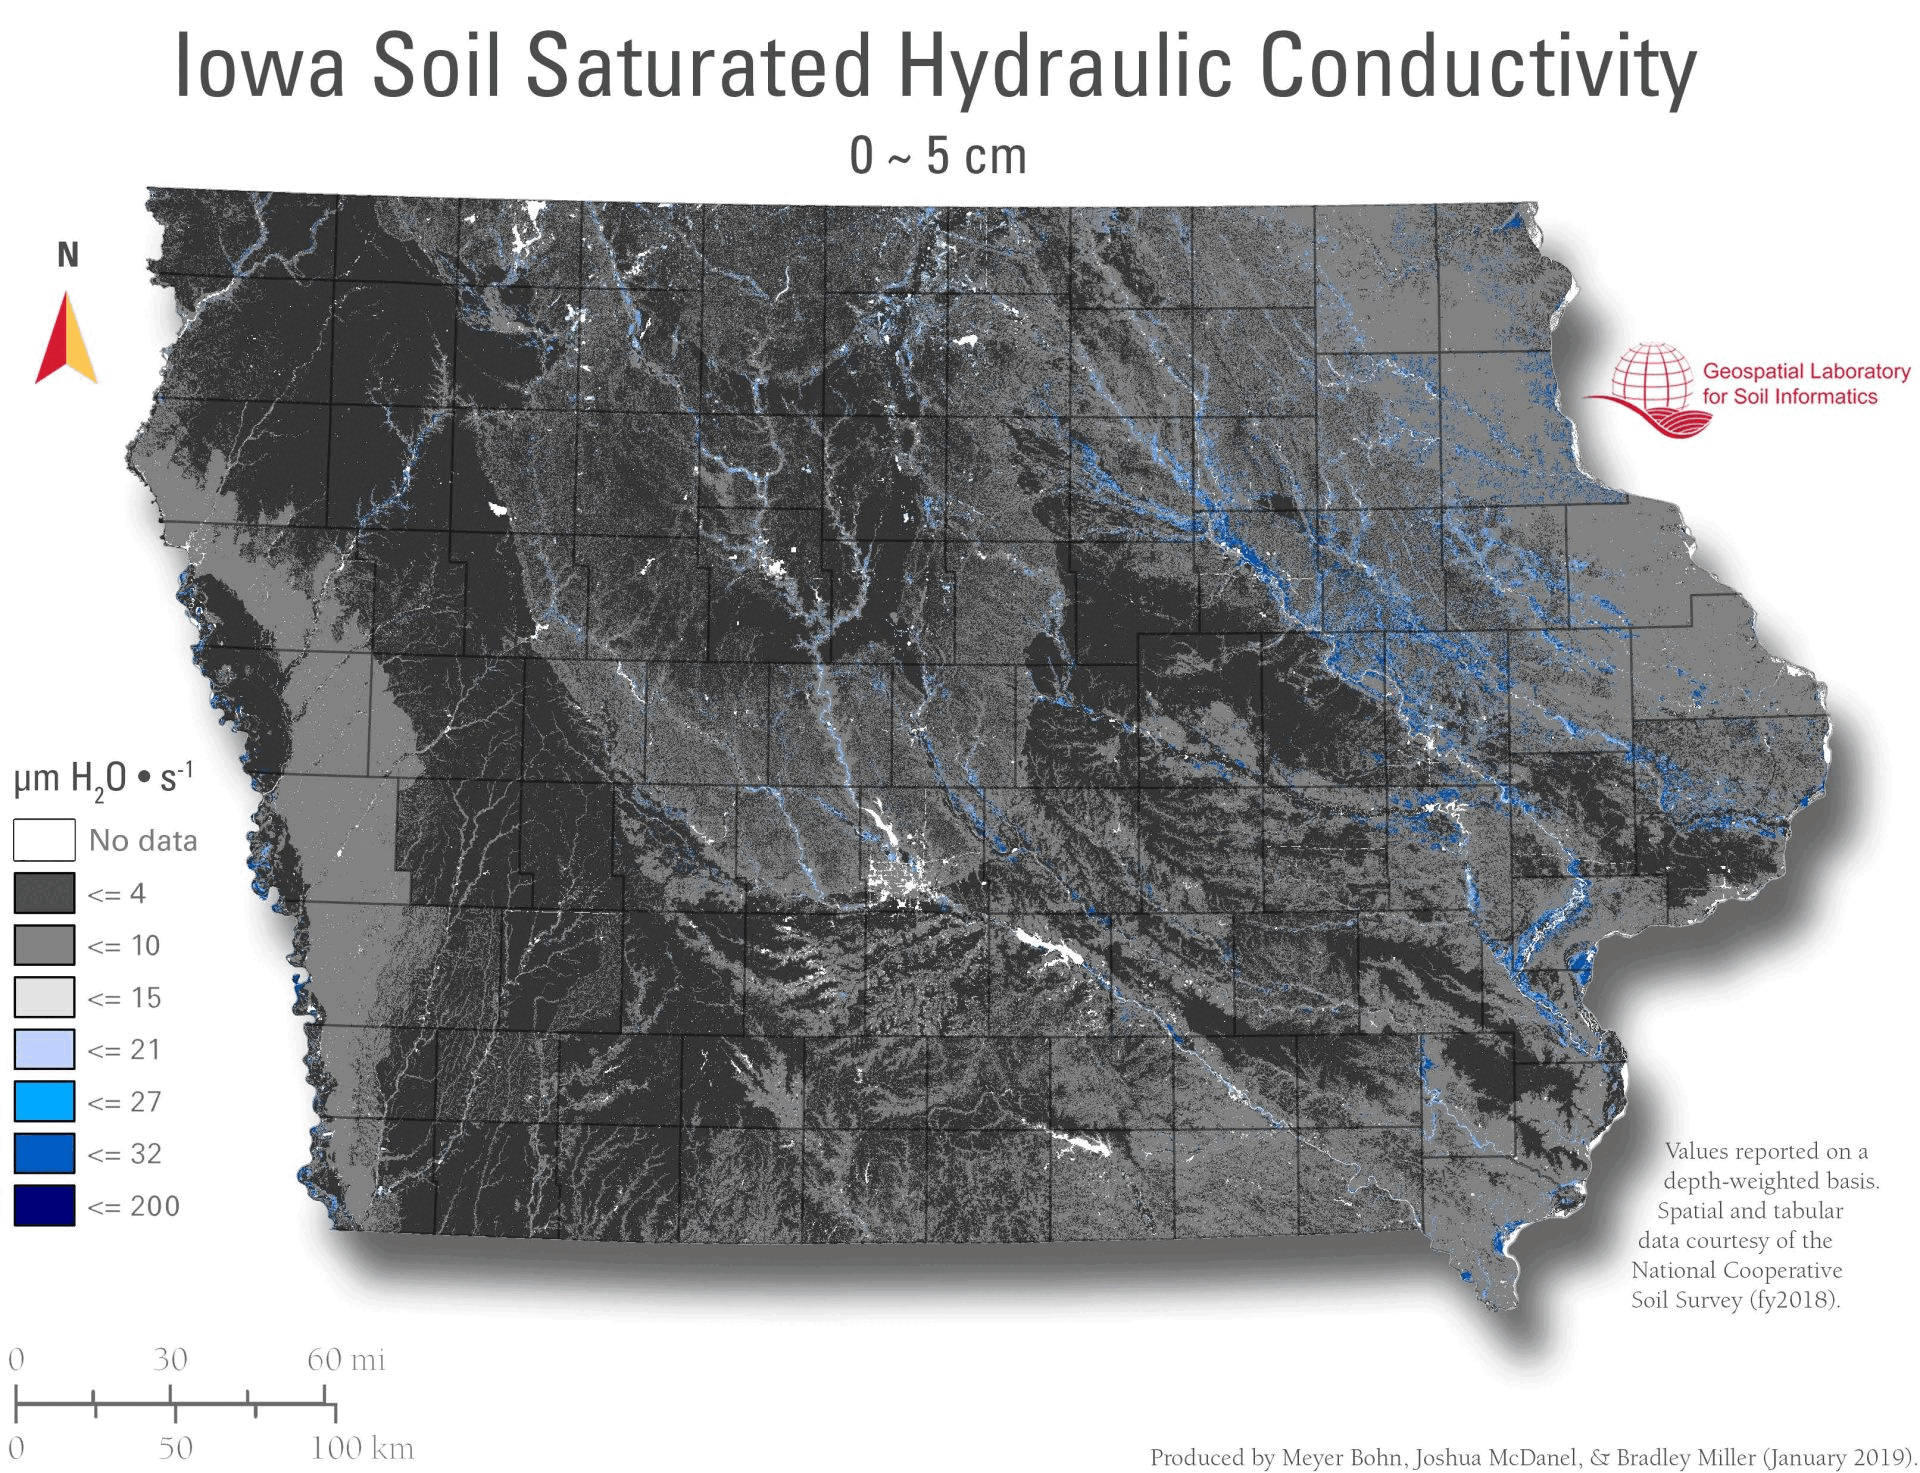
Use these maps to guide agronomy and land-management decisions: target liming and nutrient programs (pH, organic matter), assess rooting/trafficability and compaction risk (bulk density), estimate infiltration and drainage potential (hydraulic conductivity), evaluate drought/wetness exposure and irrigation needs (available water, water storage/content), and screen areas for seasonal saturation (depth to water table) and textural constraints (sand/clay).
Available Properties
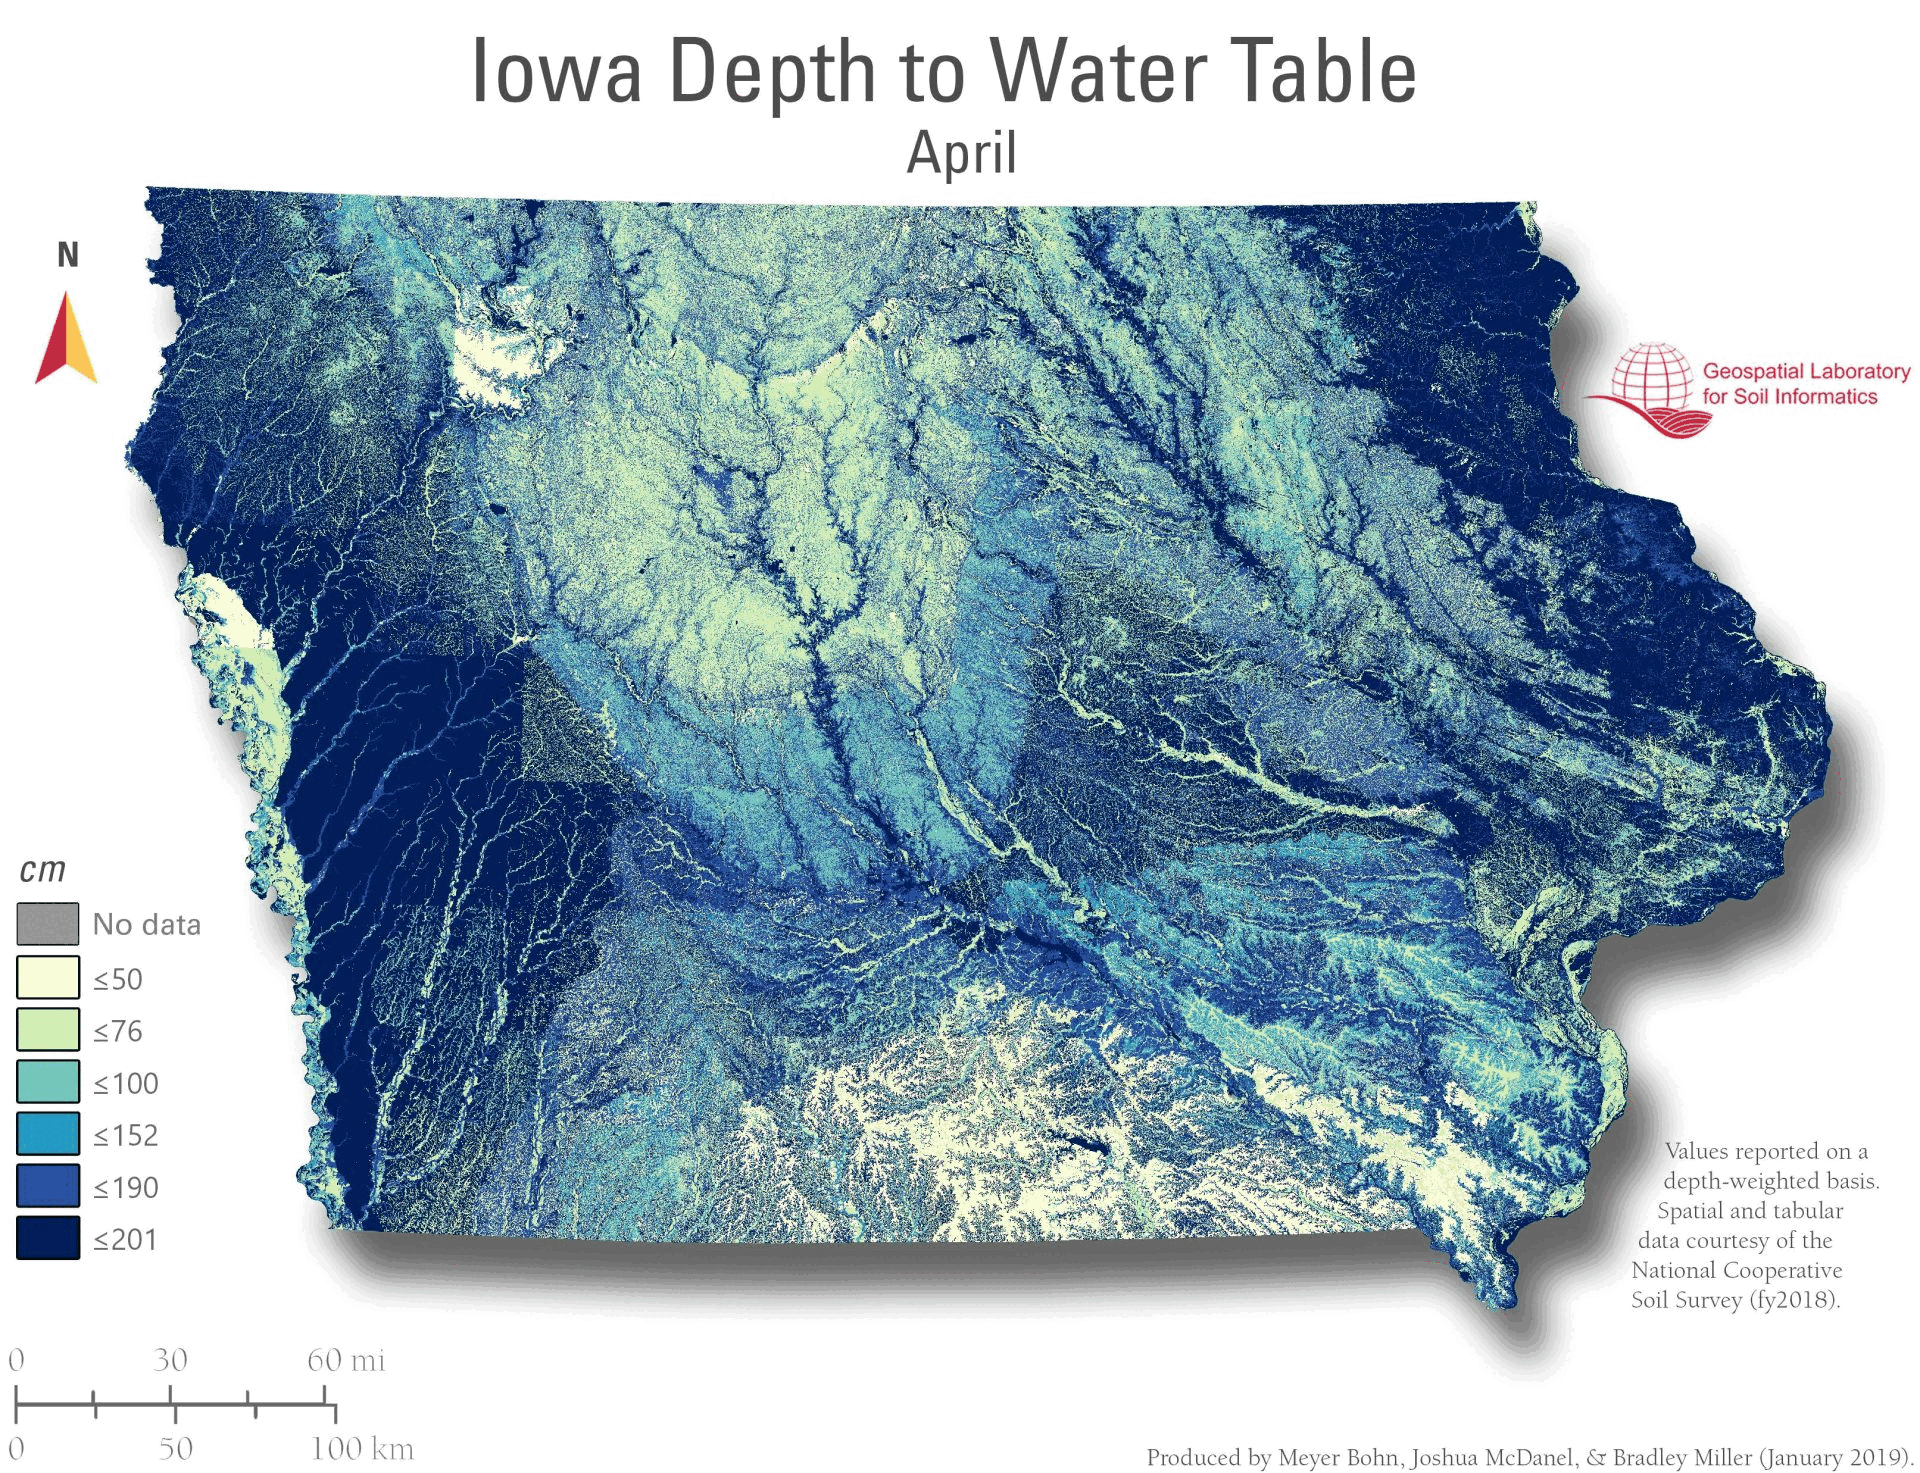
Depth to Water Table (monthly): distance from surface to the saturated zone; shallower depths indicate seasonal wetness risk.
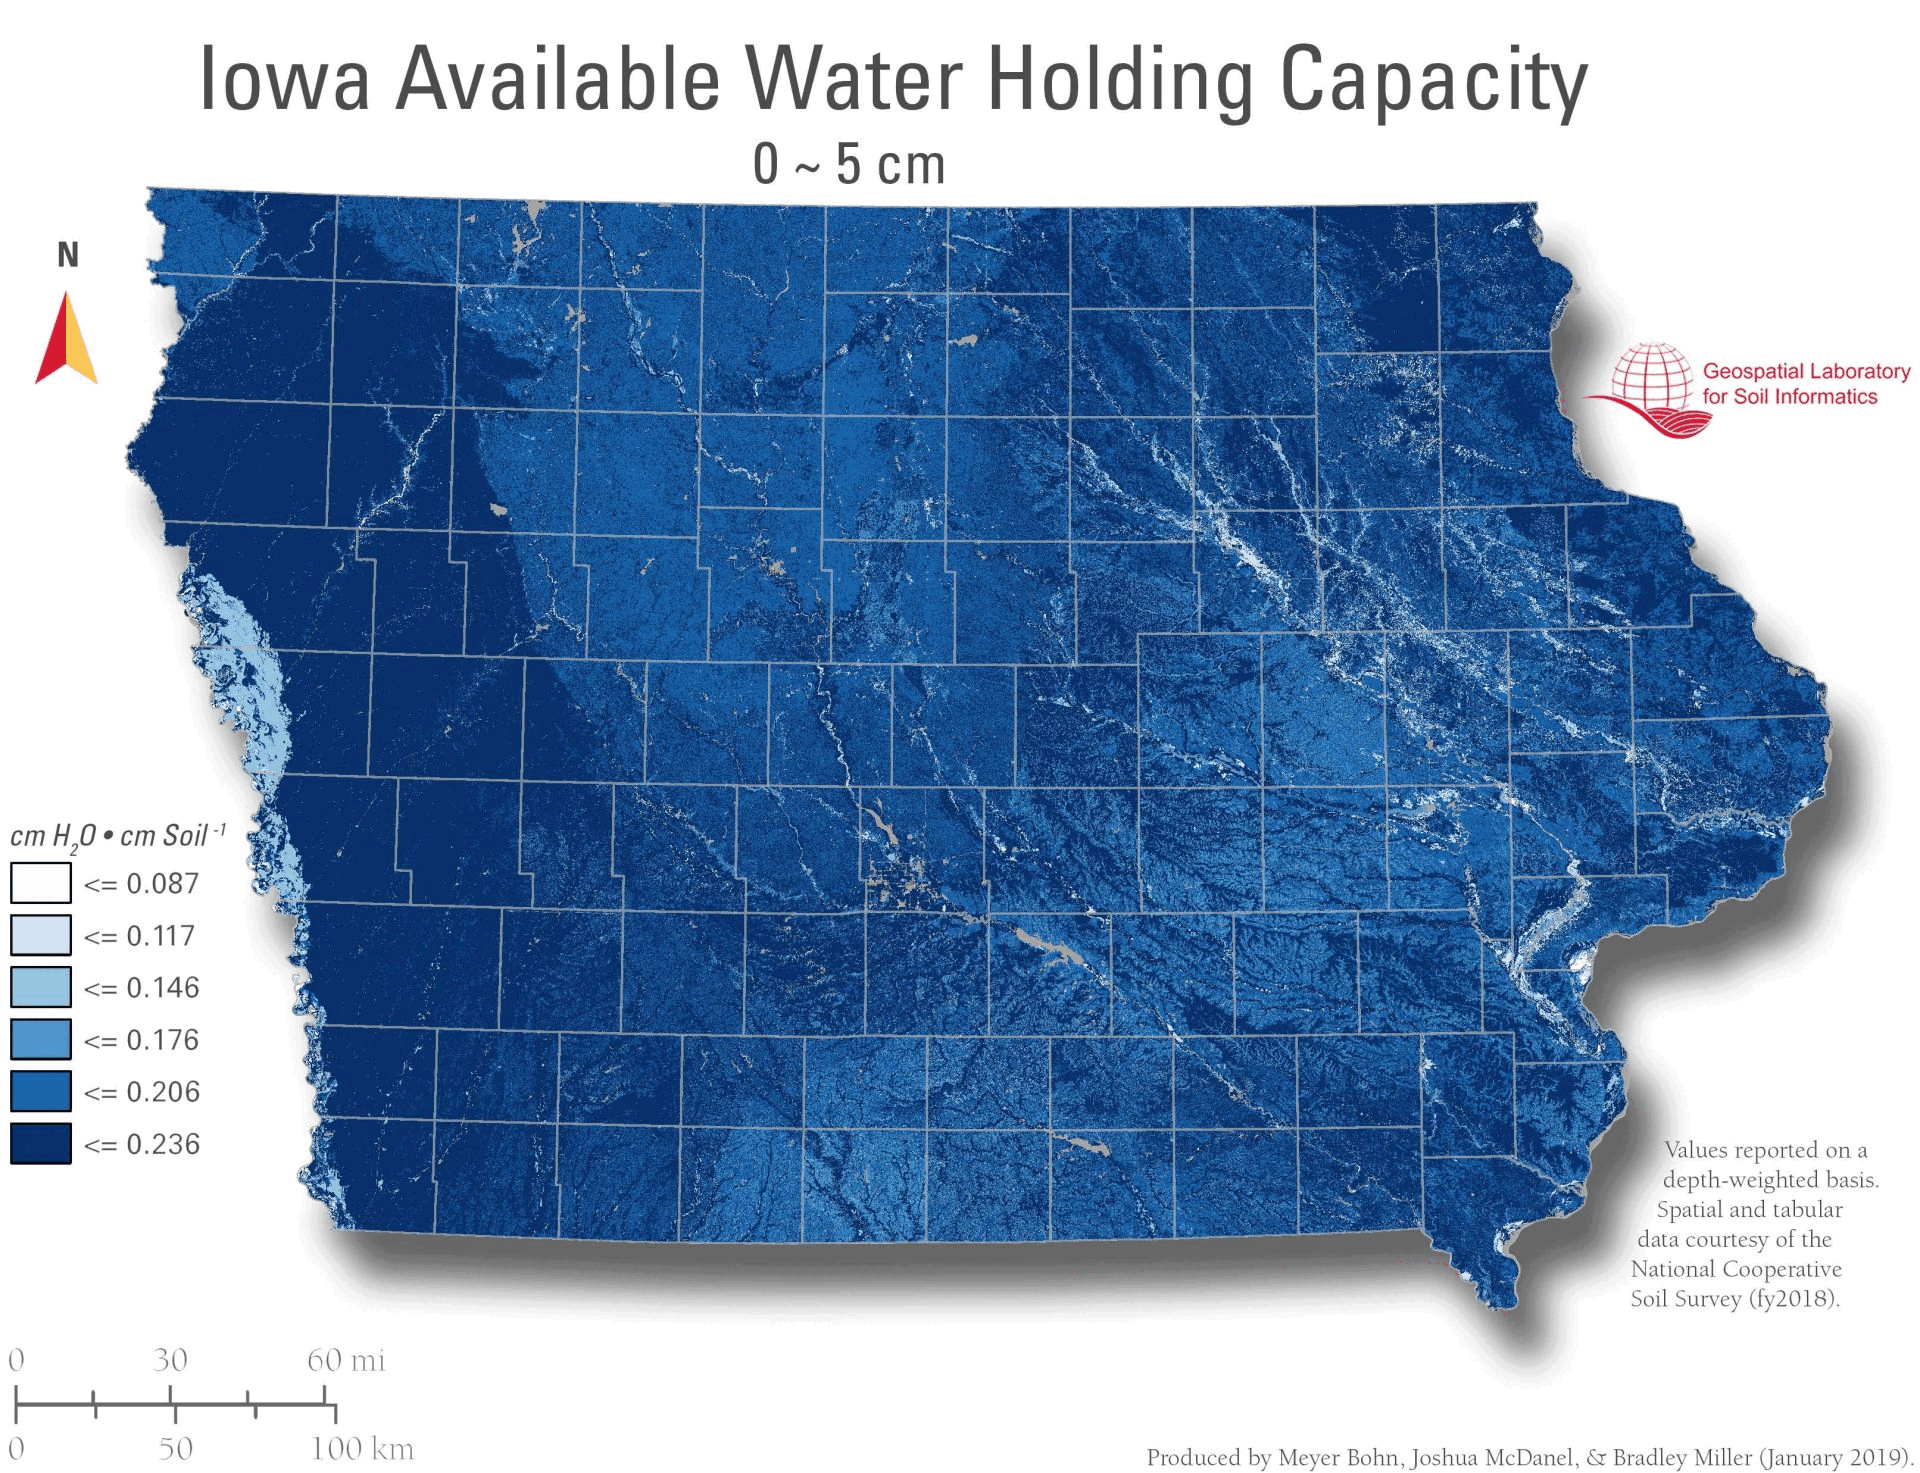
Available Water-Holding Capacity: plant-available water between field capacity and wilting point.
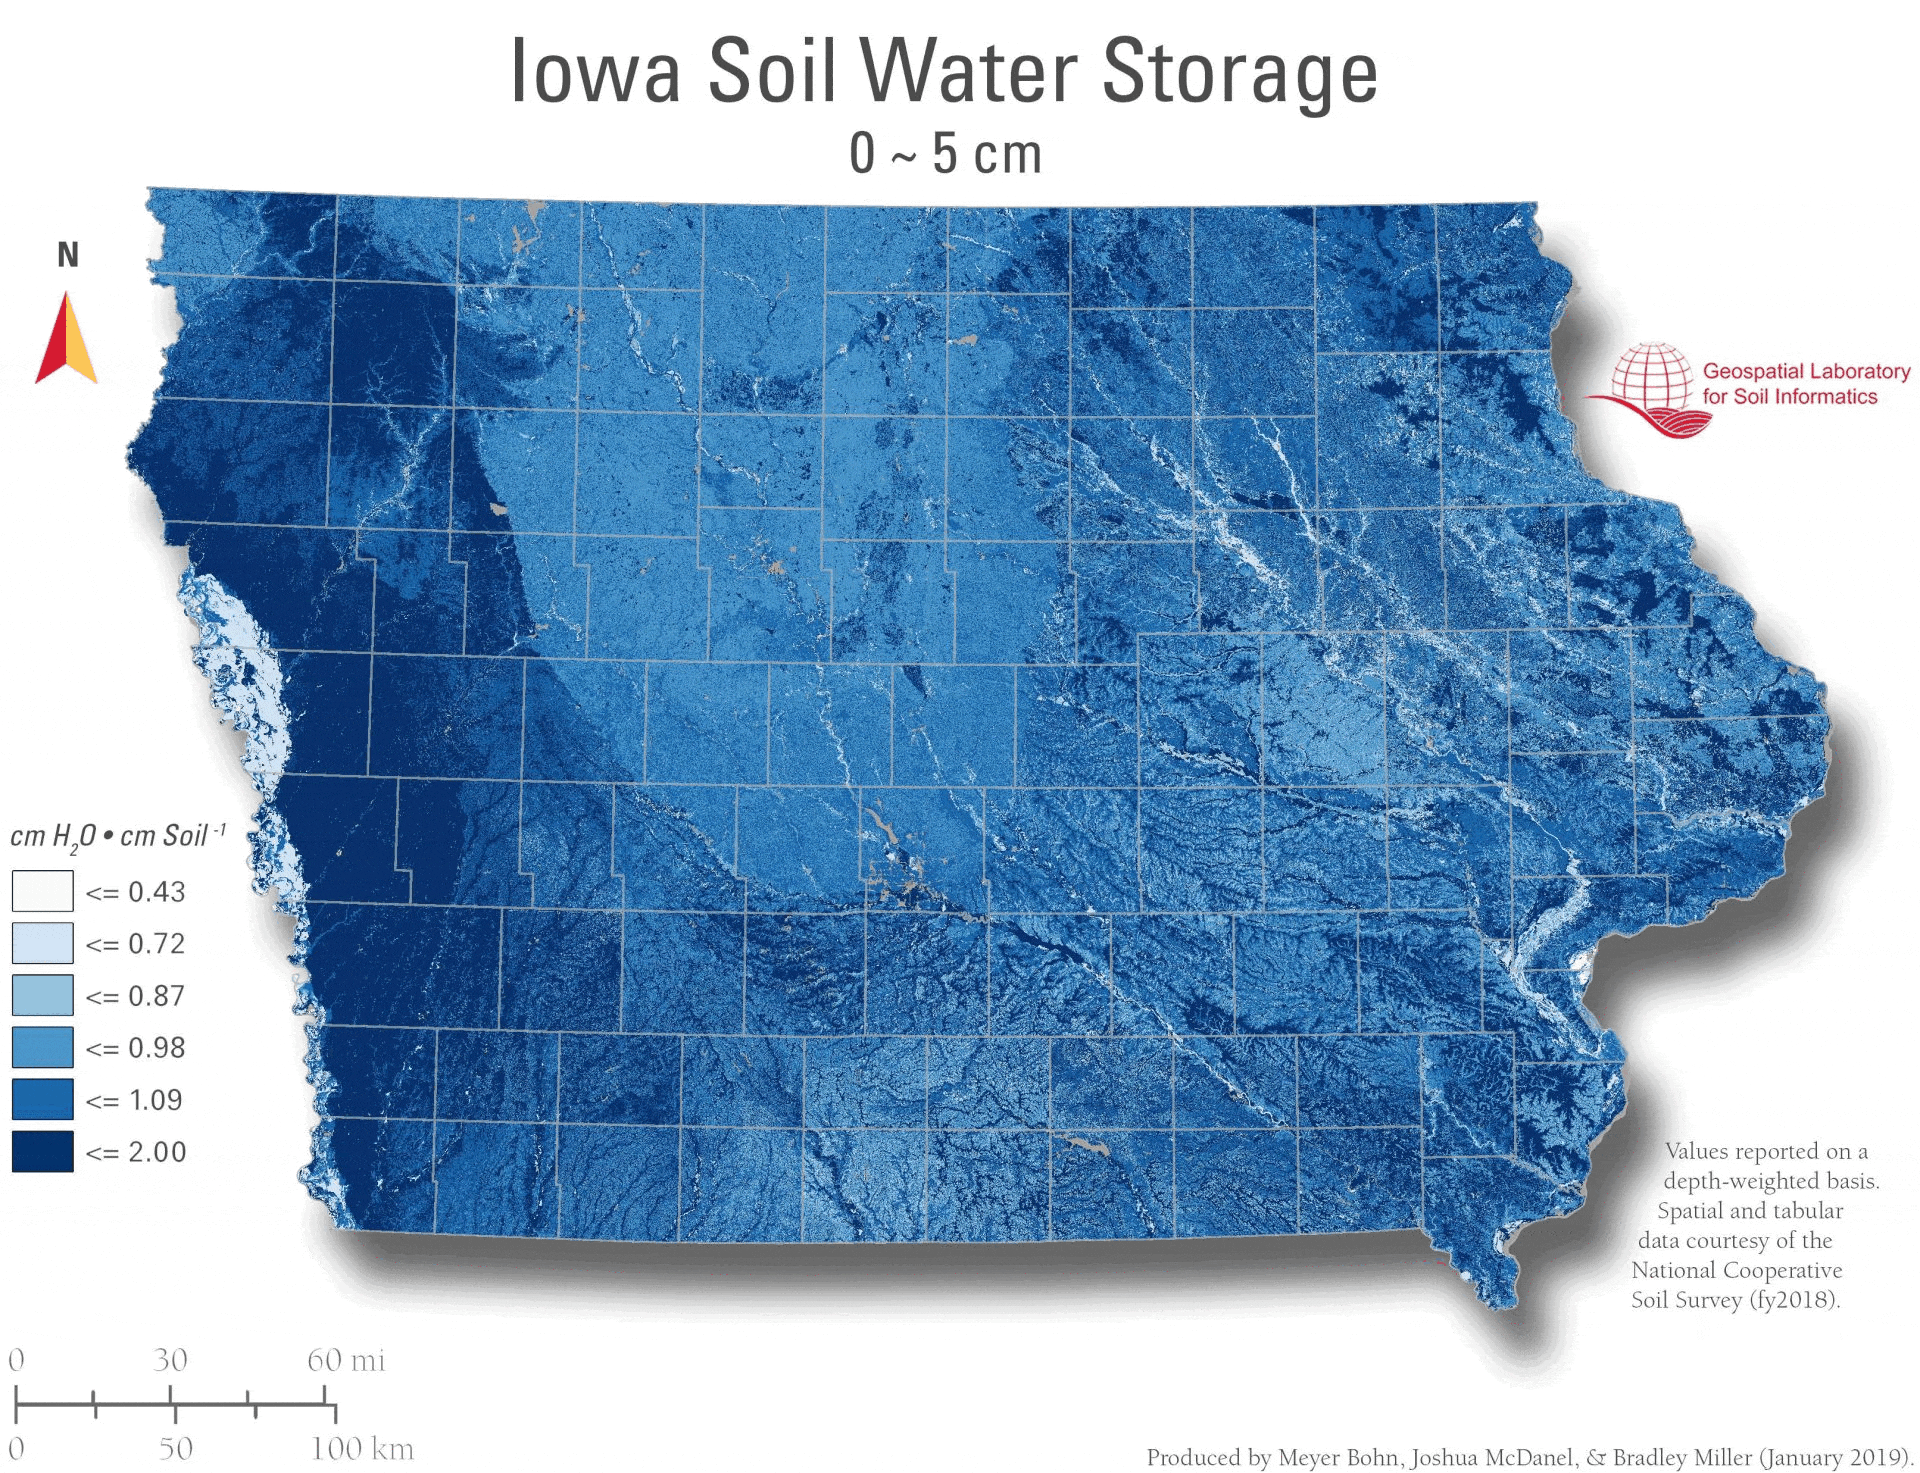
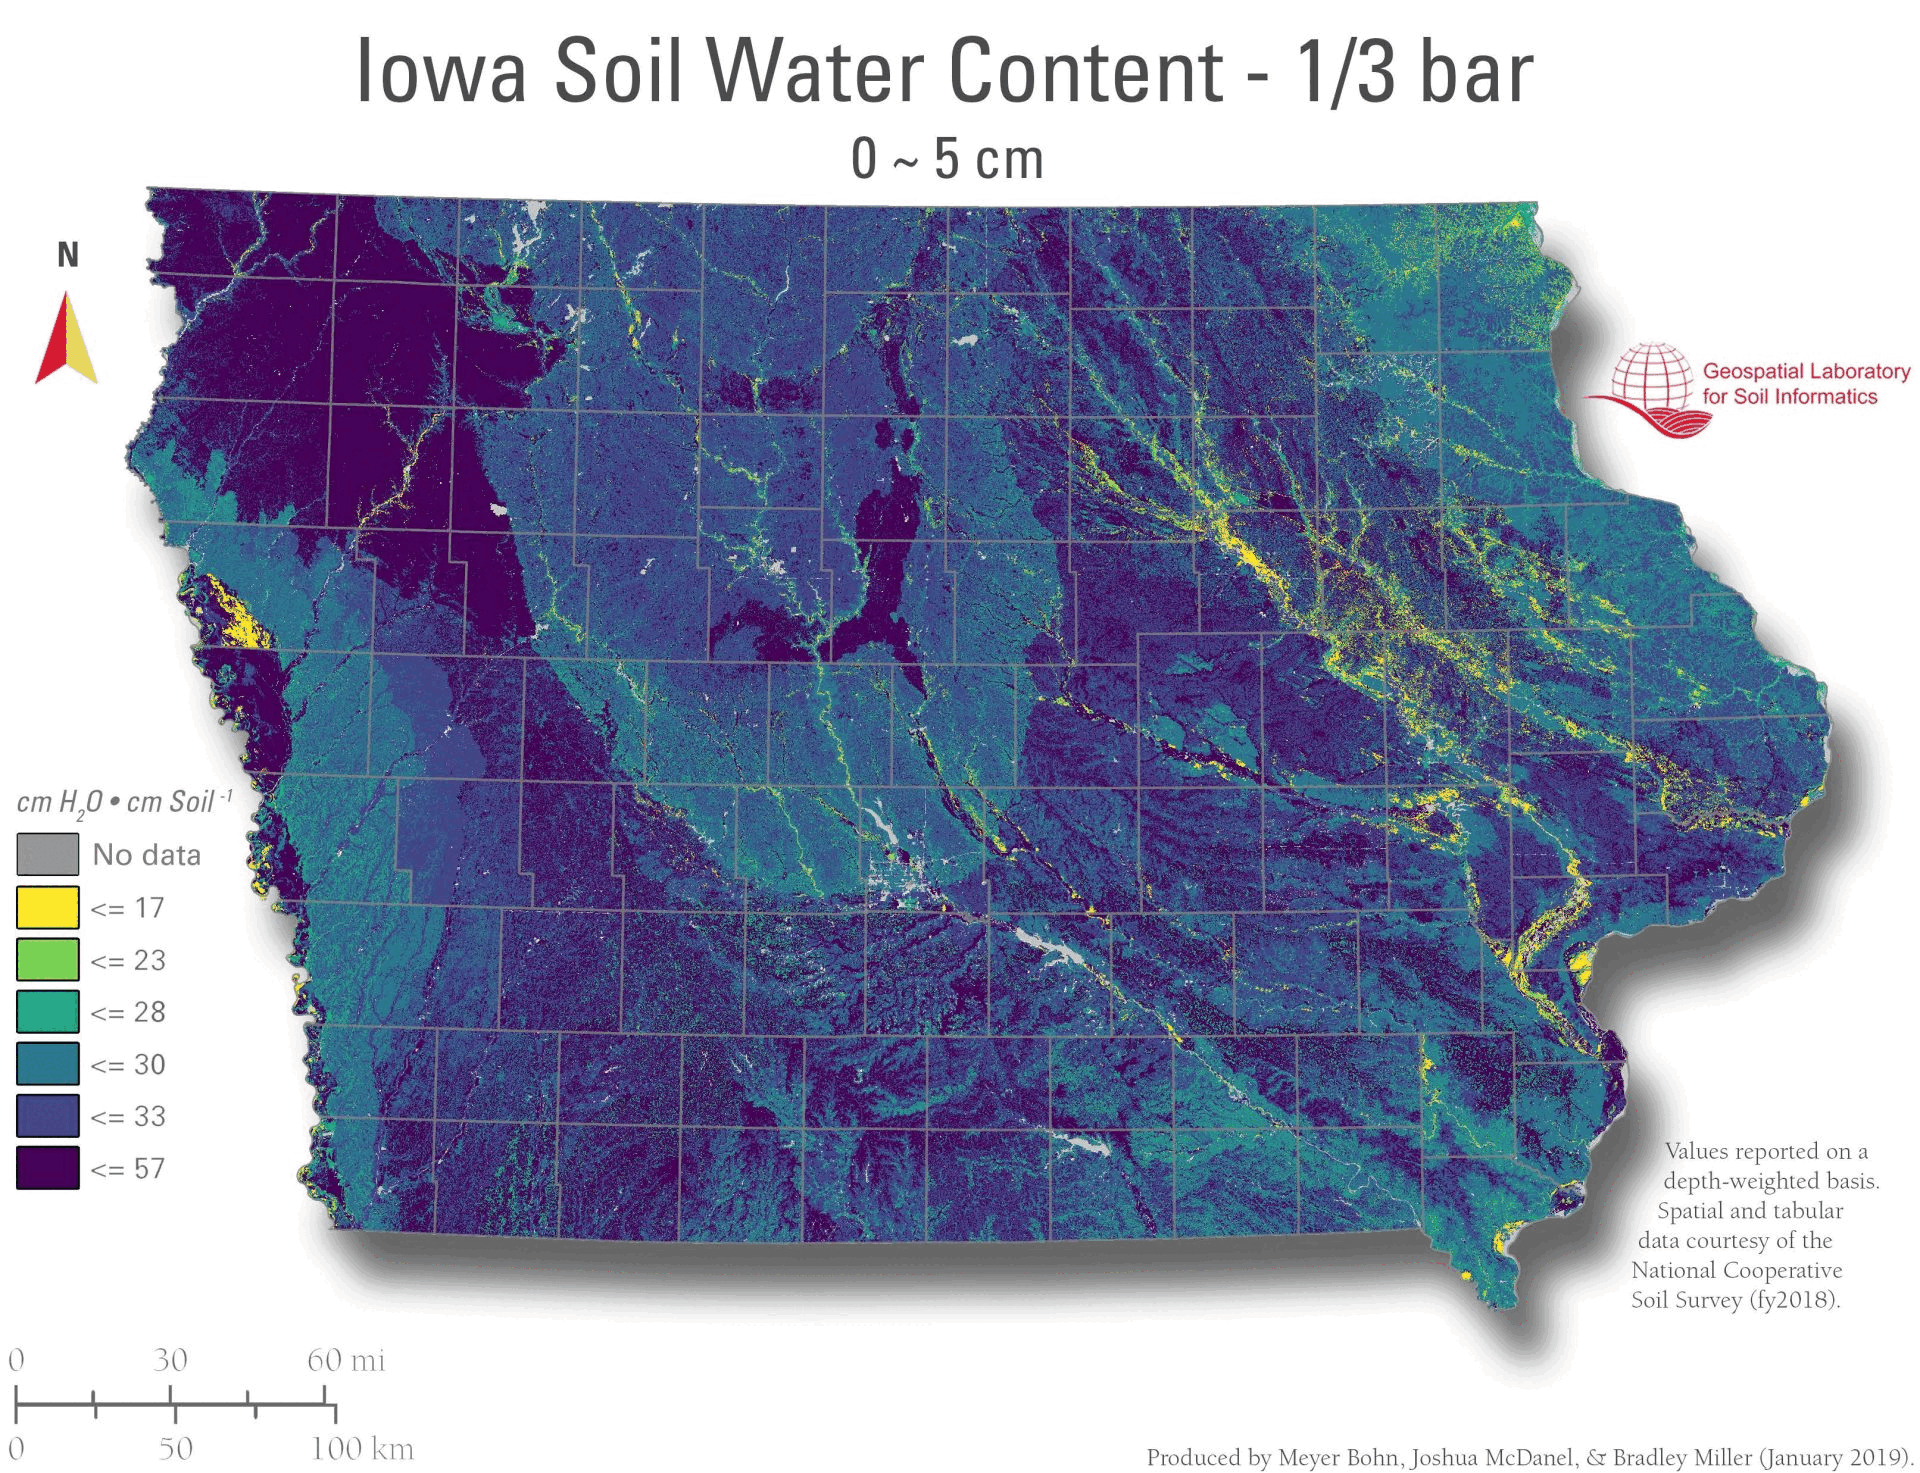
Soil Water Storage / Content (1/3 bar): approximates water near field capacity.
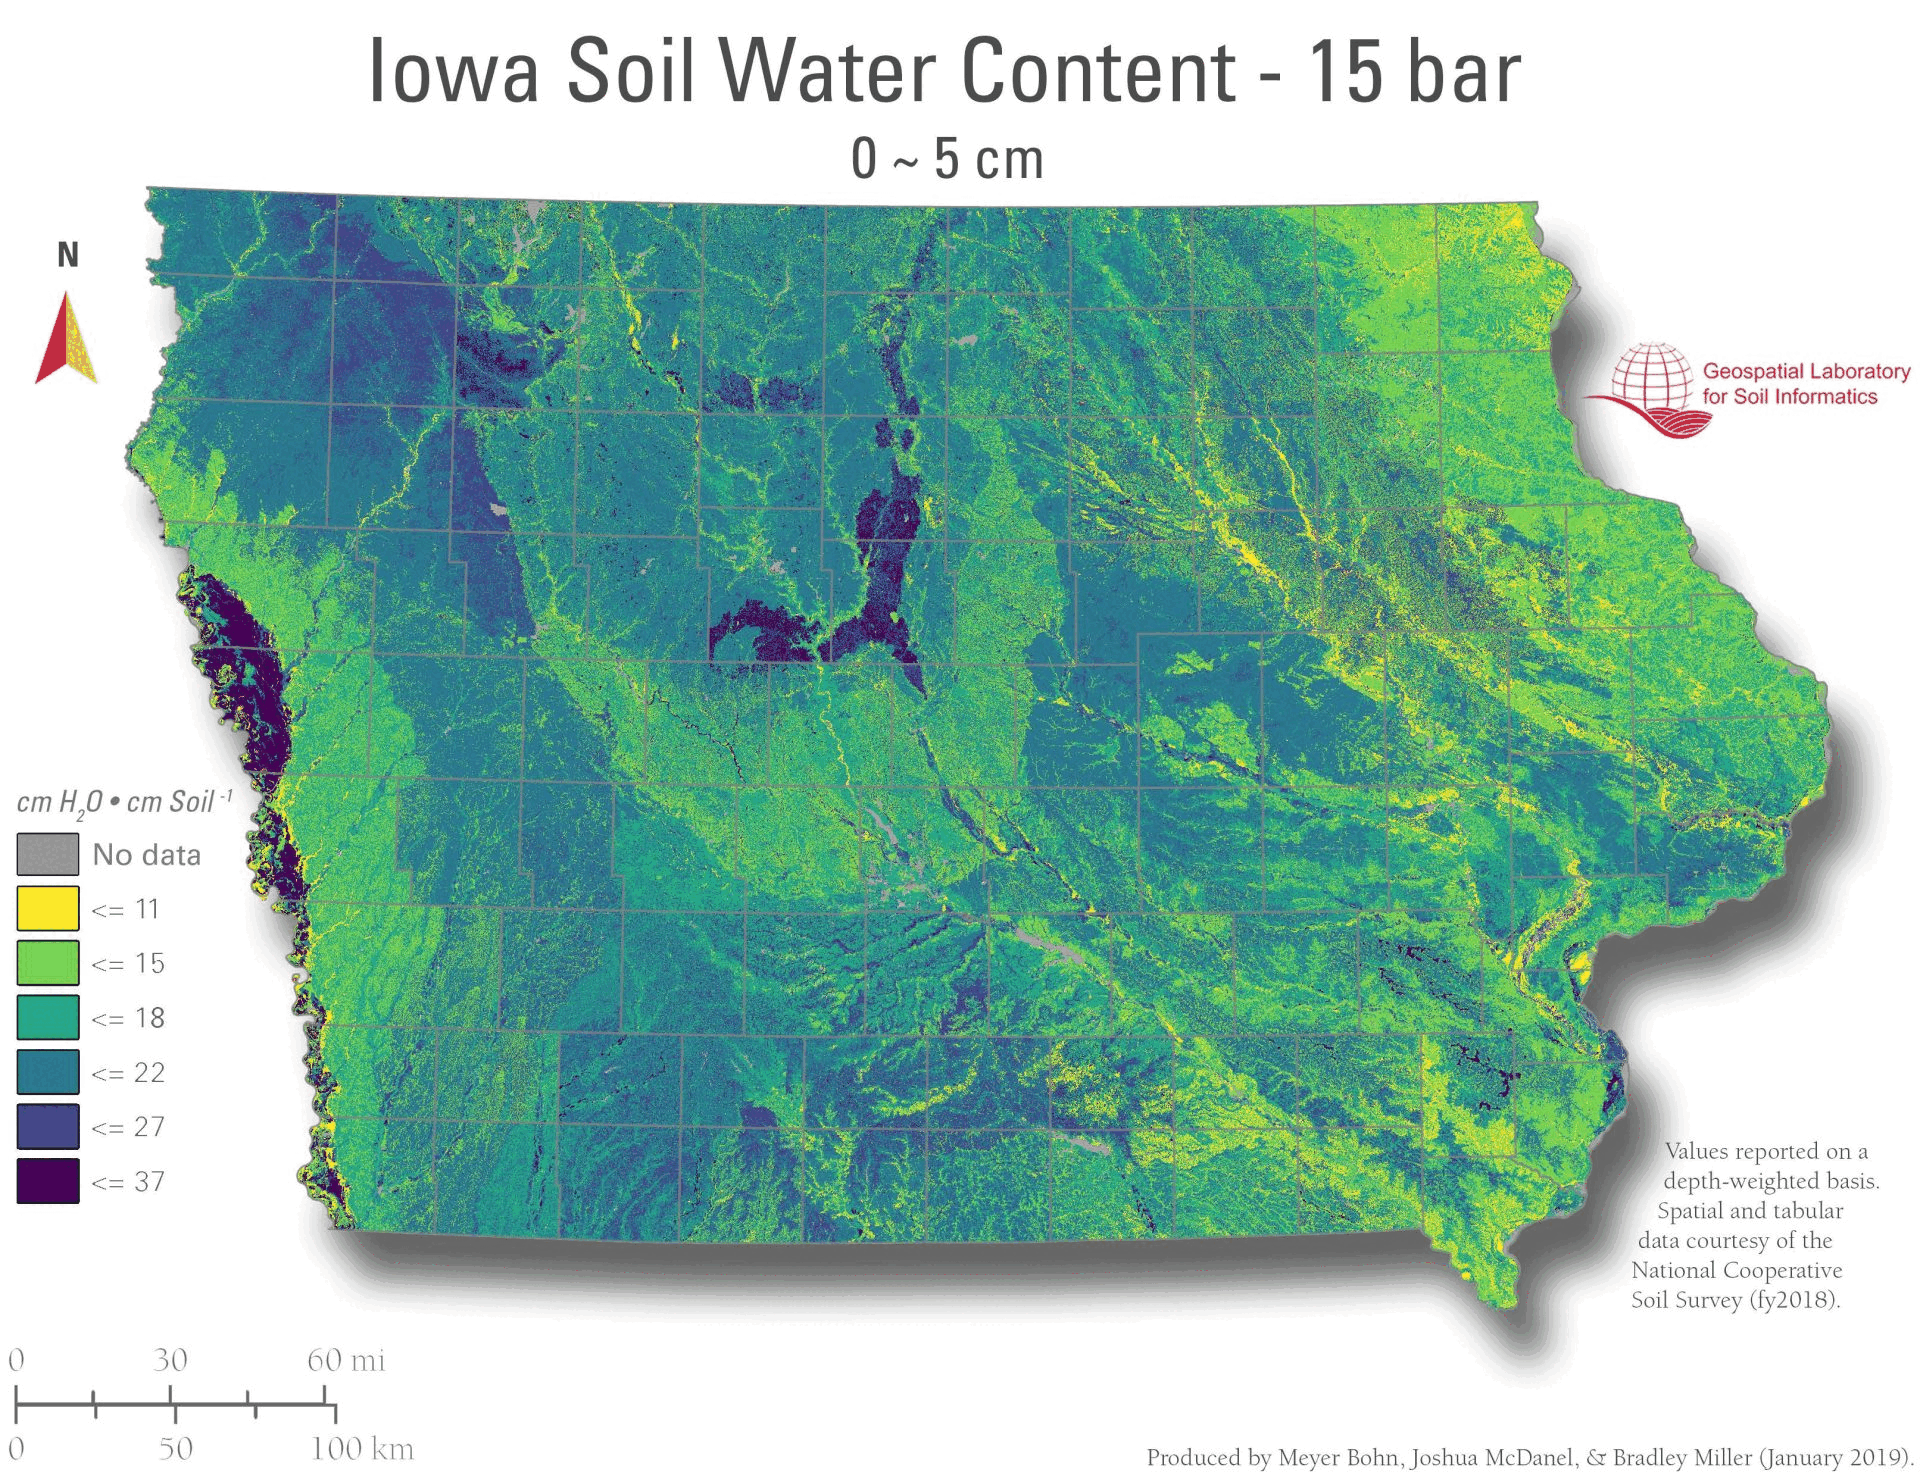
Soil Water Content (15 bar): approximates water at wilting point.
Saturated Hydraulic Conductivity (Ksat): potential infiltration/drainage rate under saturation.
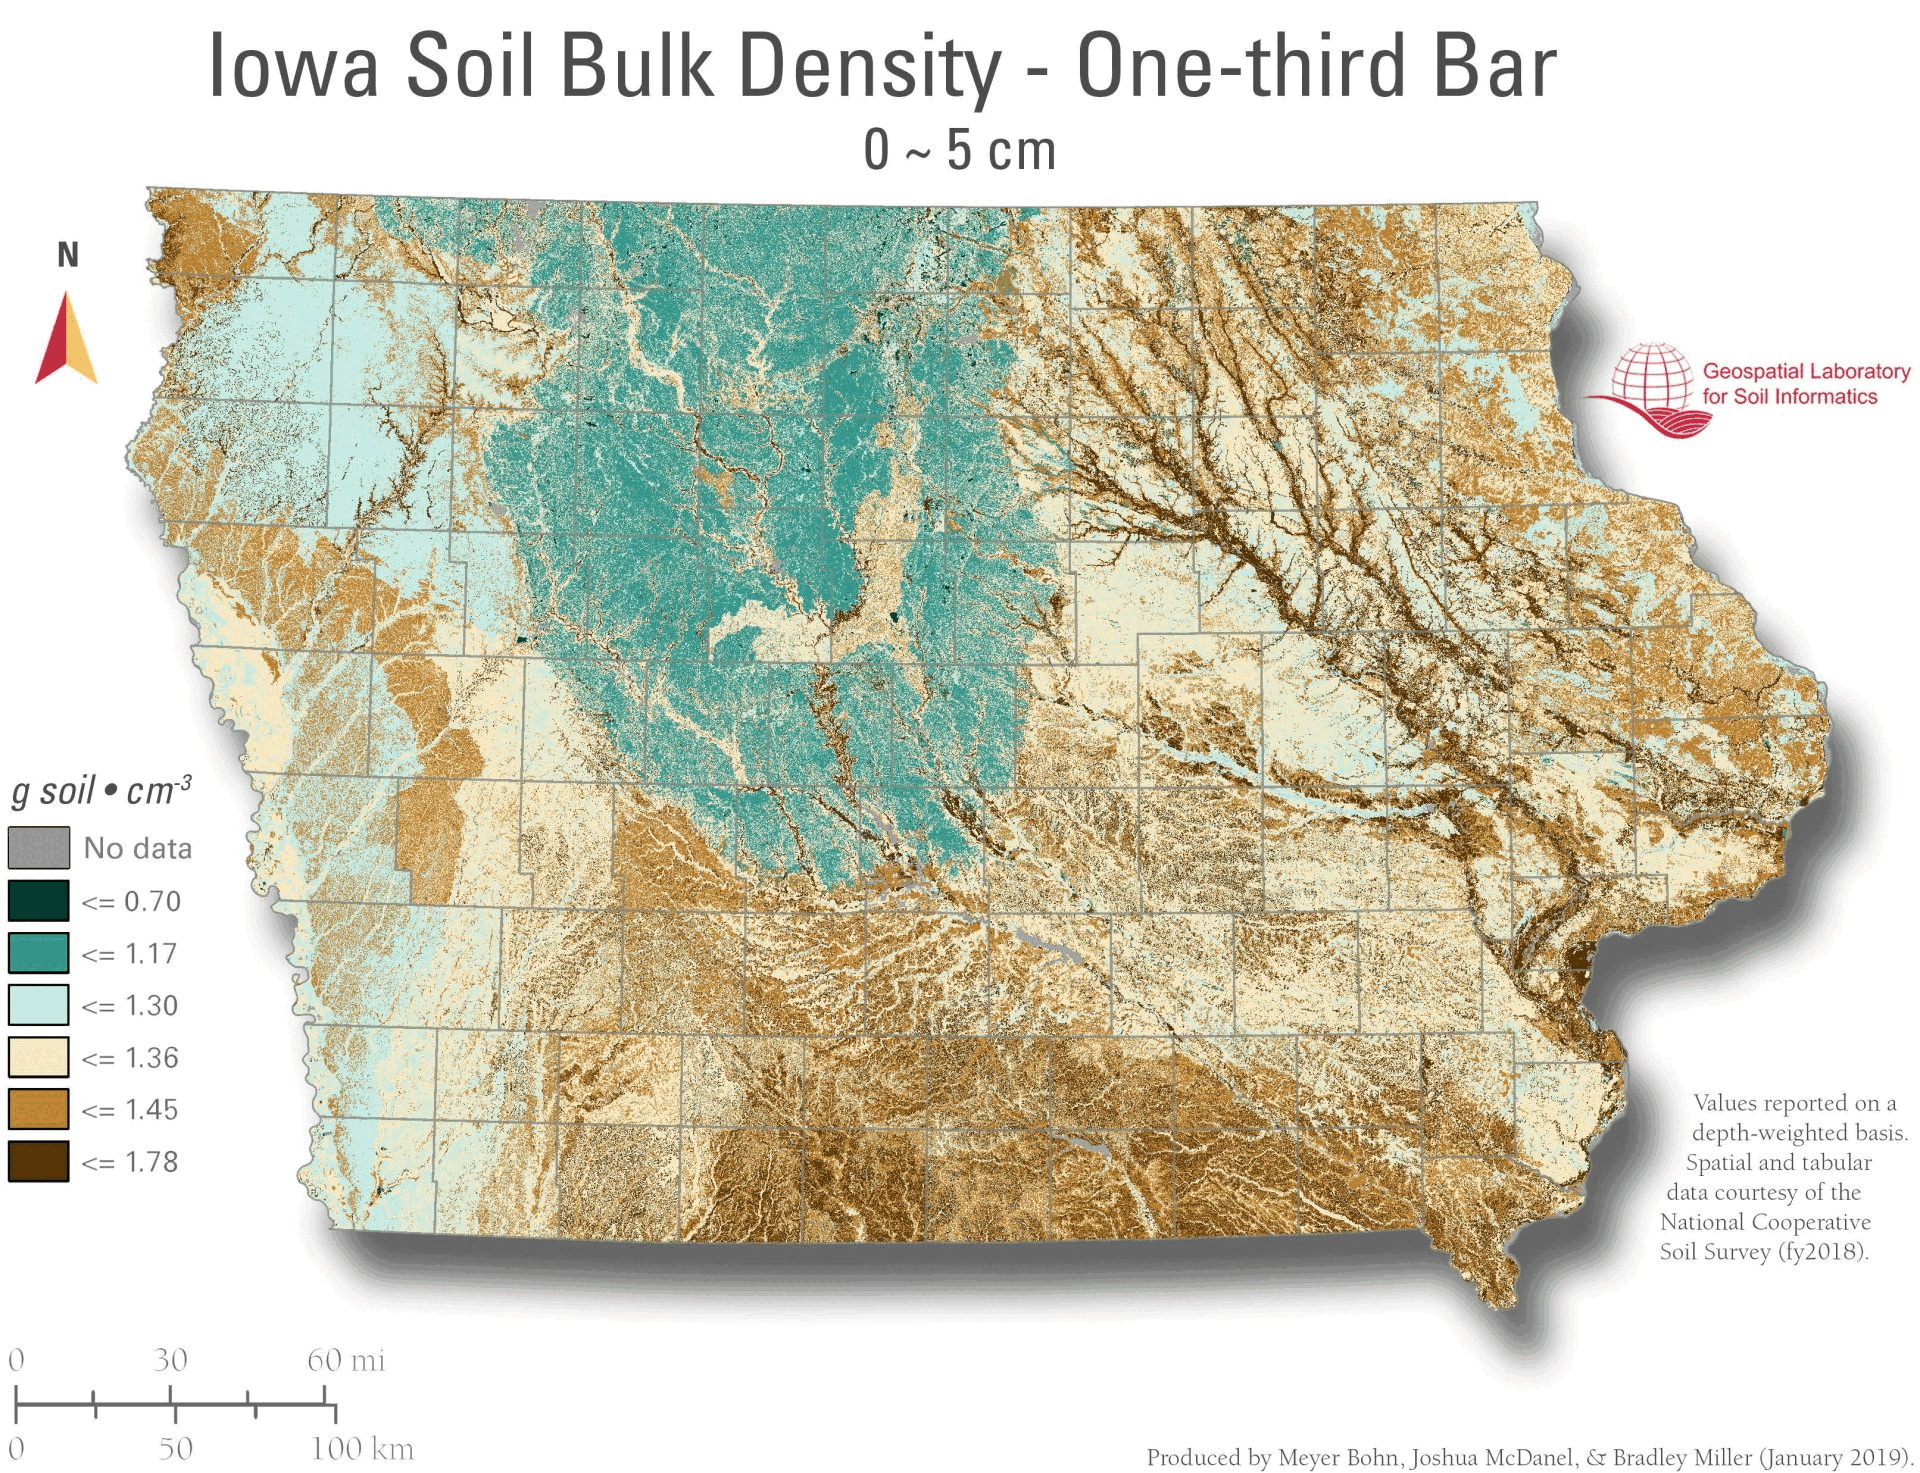
Bulk Density (1/3 bar): soil mass per volume near field capacity; relates to compaction and root growth.
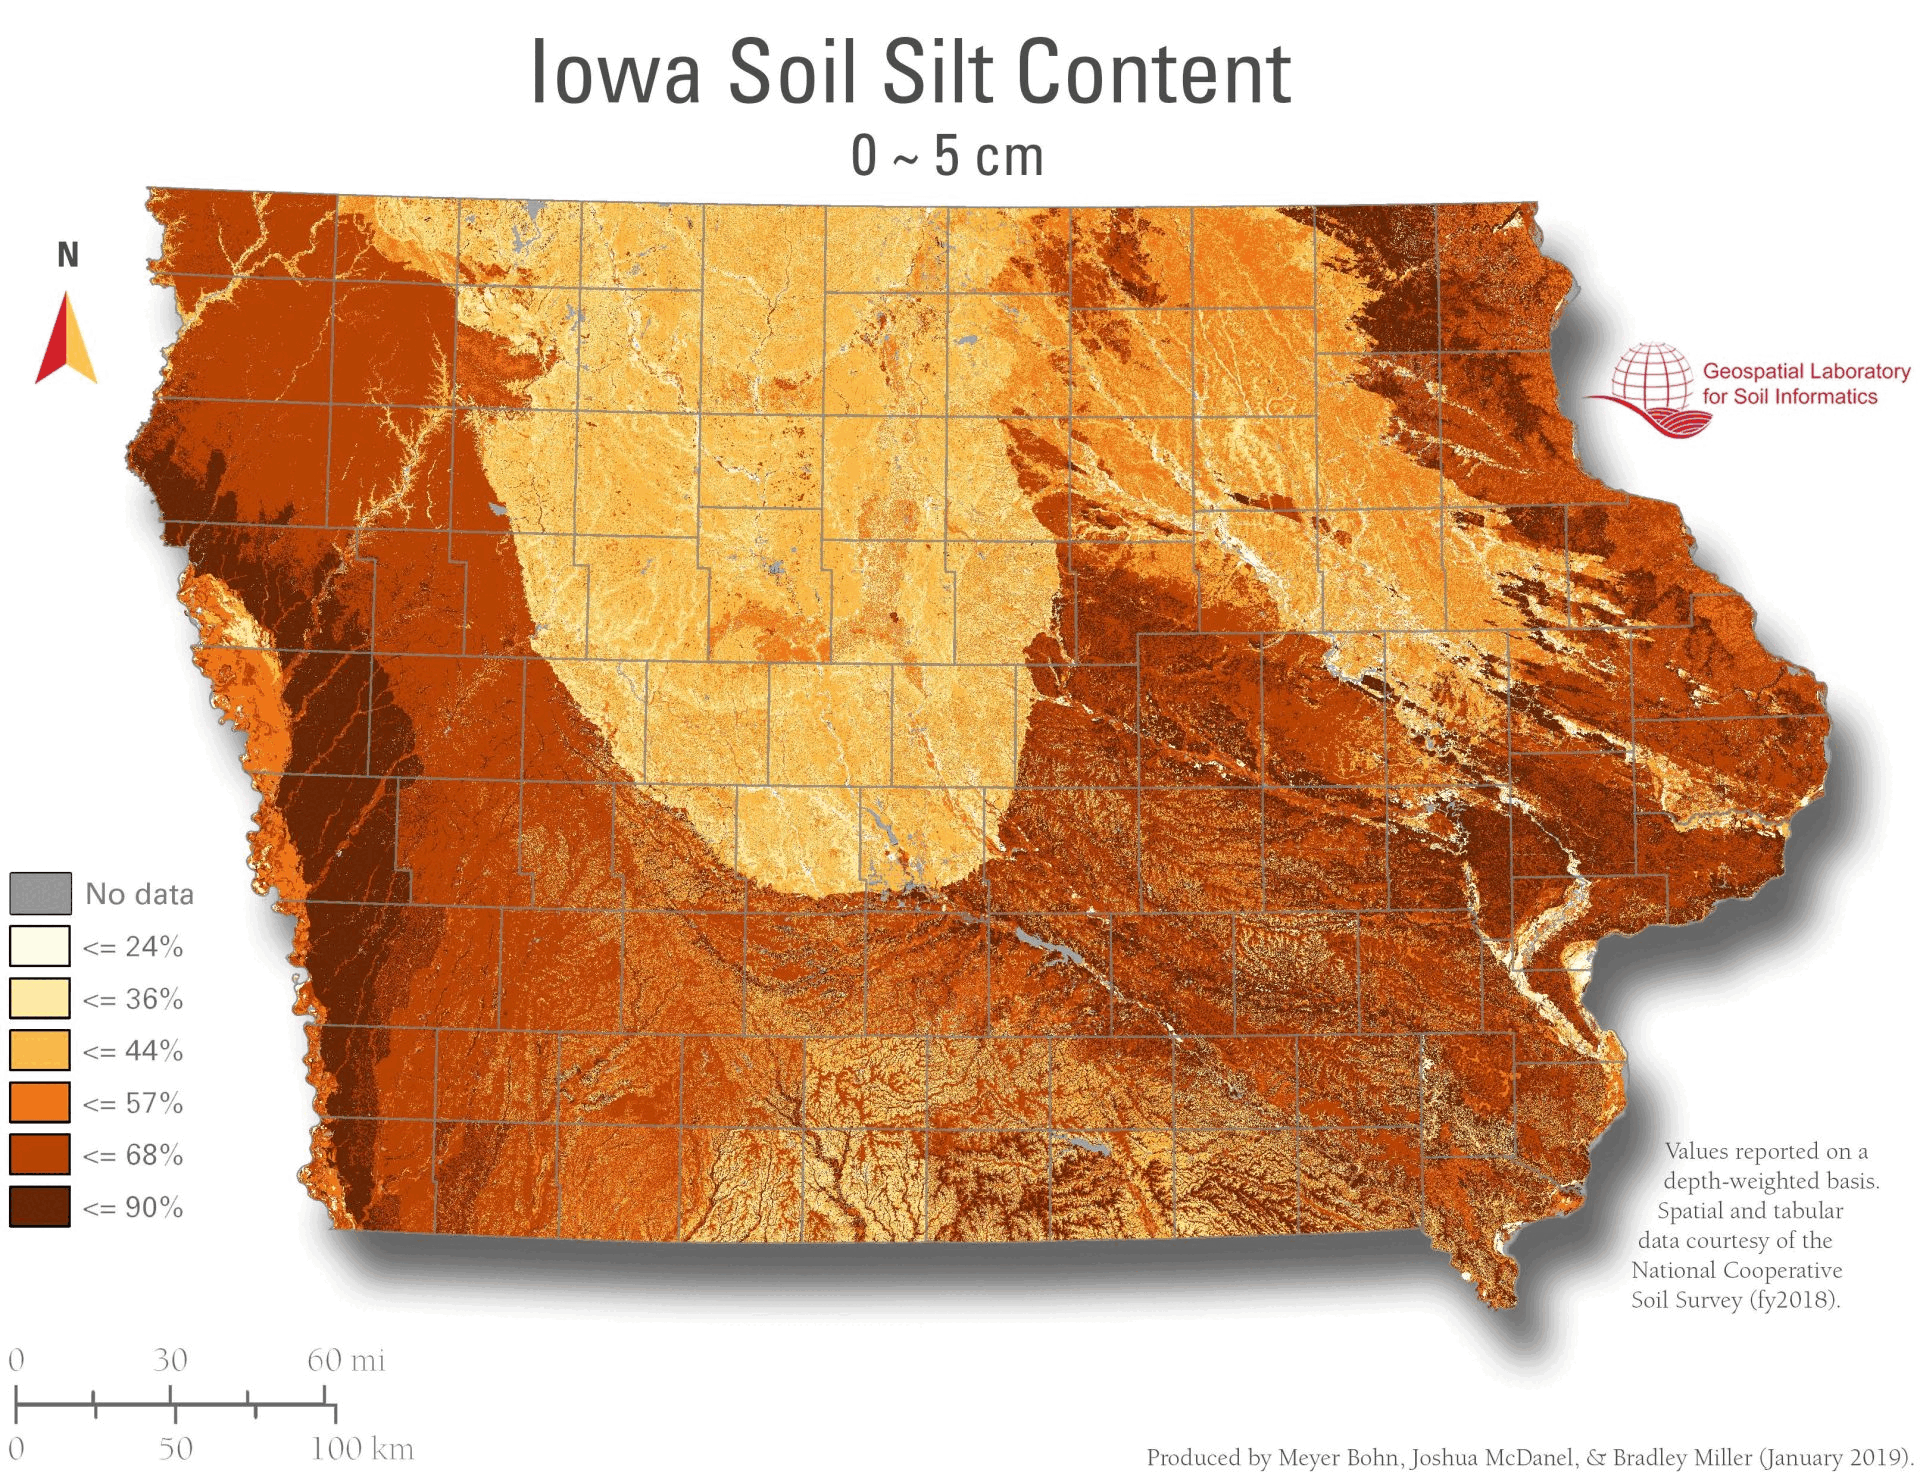
Clay Content / Sand Content: particle-size fractions that drive water, nutrient, and engineering behavior.
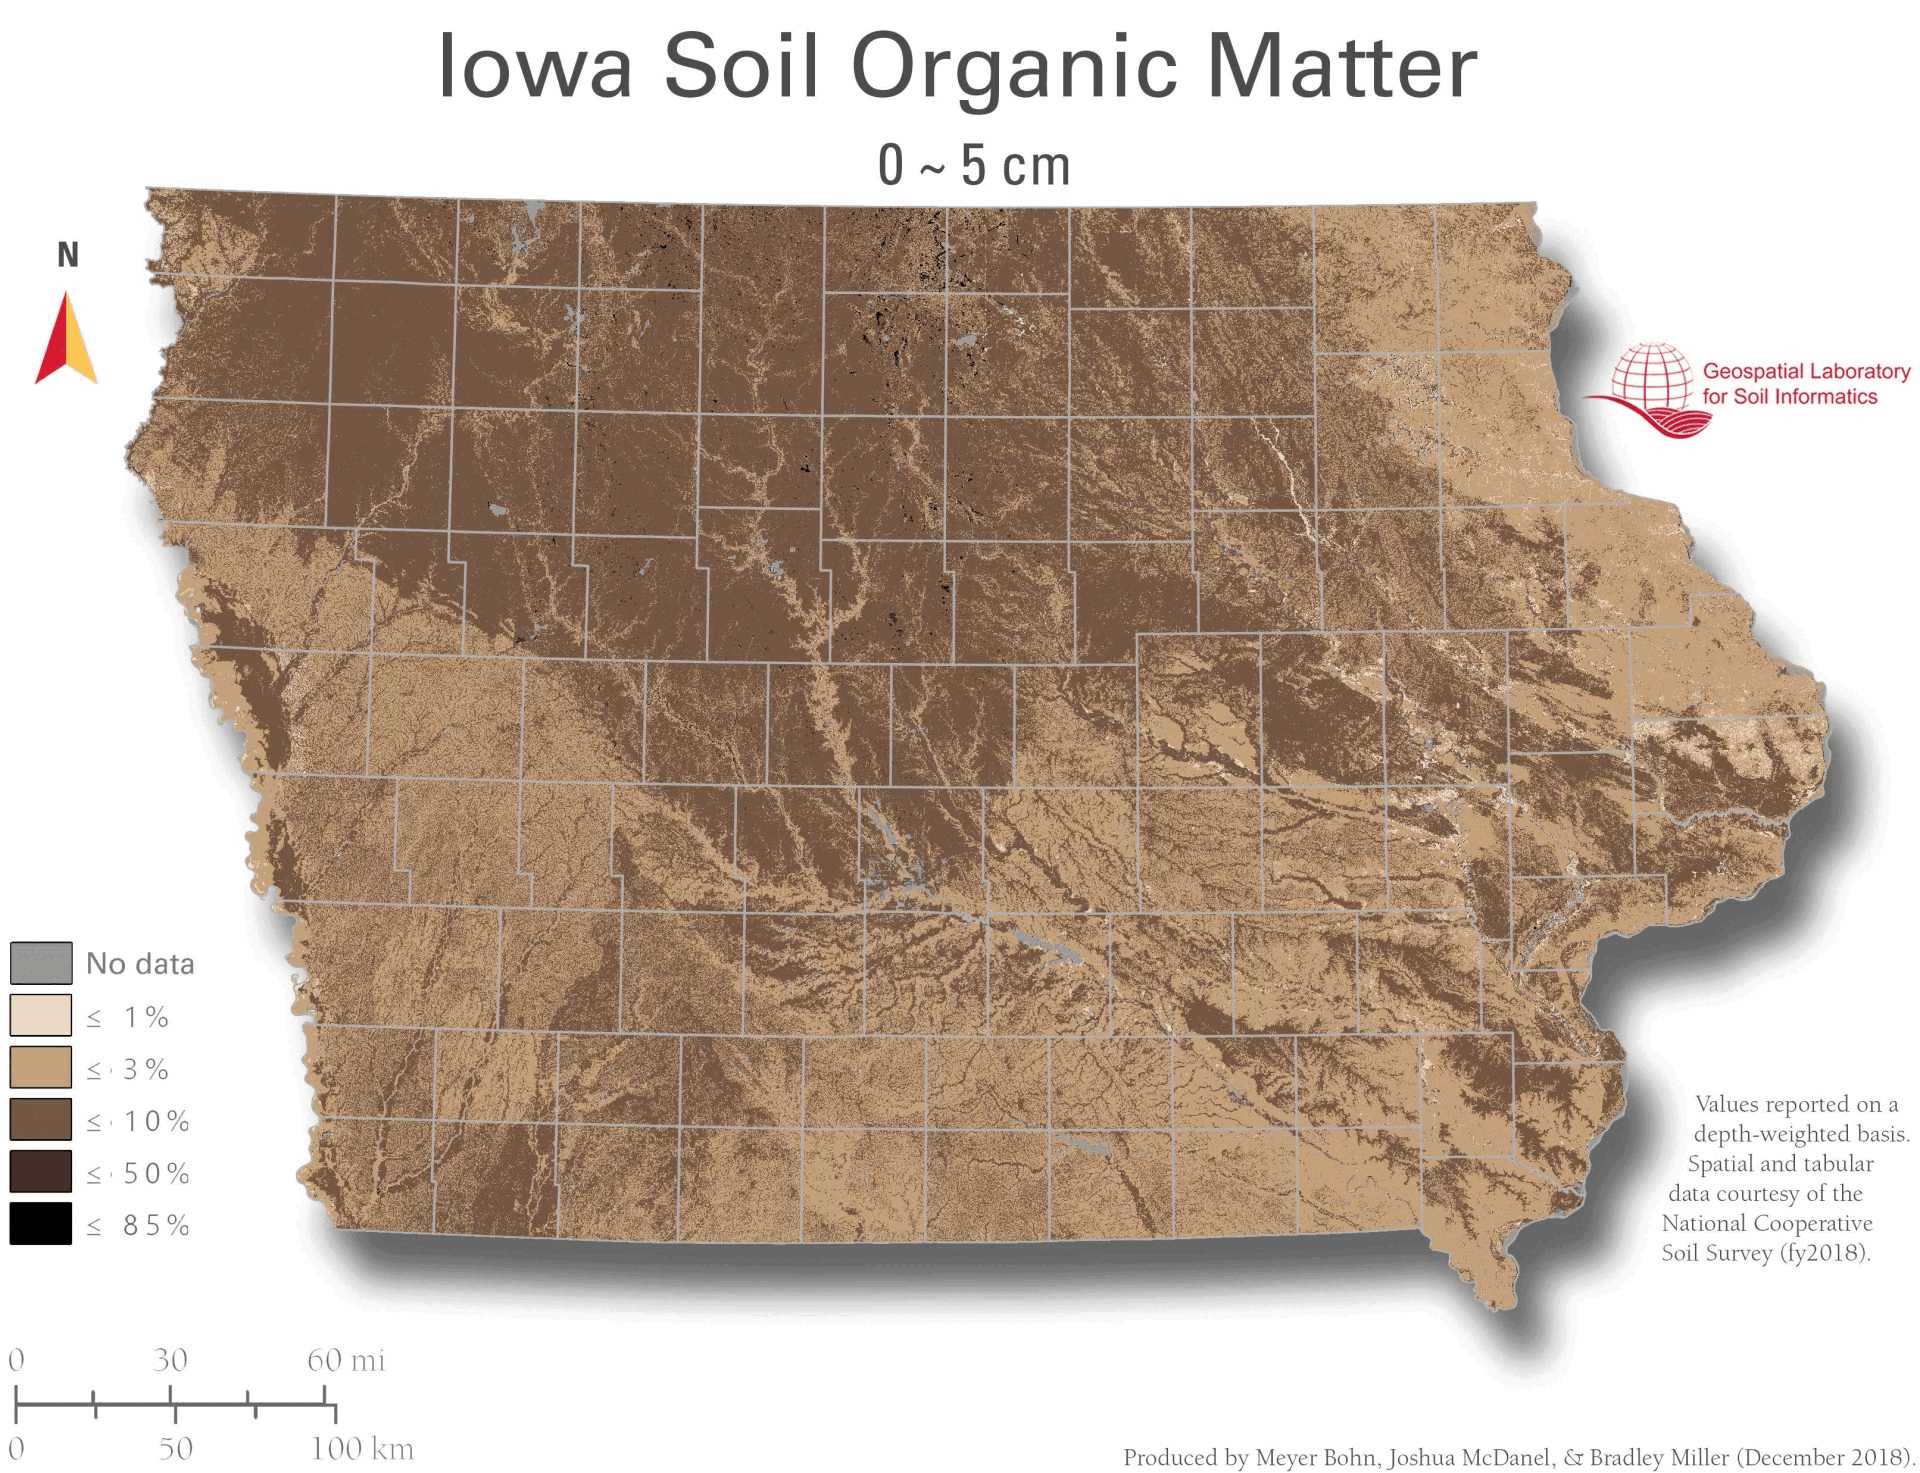
Organic Matter: indicator of fertility, structure, and carbon stocks.
Depth Intervals Shown in Animations
0–5 cm, 5–20 cm, 20–50 cm, 50–100 cm, 100–150 cm, 150–200 cm
(Composite intervals may also appear: 0–20, 0–50, 0–100, 0–200 cm.)