This gallery animates statewide maps from deep subsoil to the surface (150–200 cm → 0–5 cm). The descending sequence makes vertical stratification obvious—where limitations emerge near the surface or persist at depth—across Iowa’s landscapes. Color scales are consistent within each property.
Applied Relevance
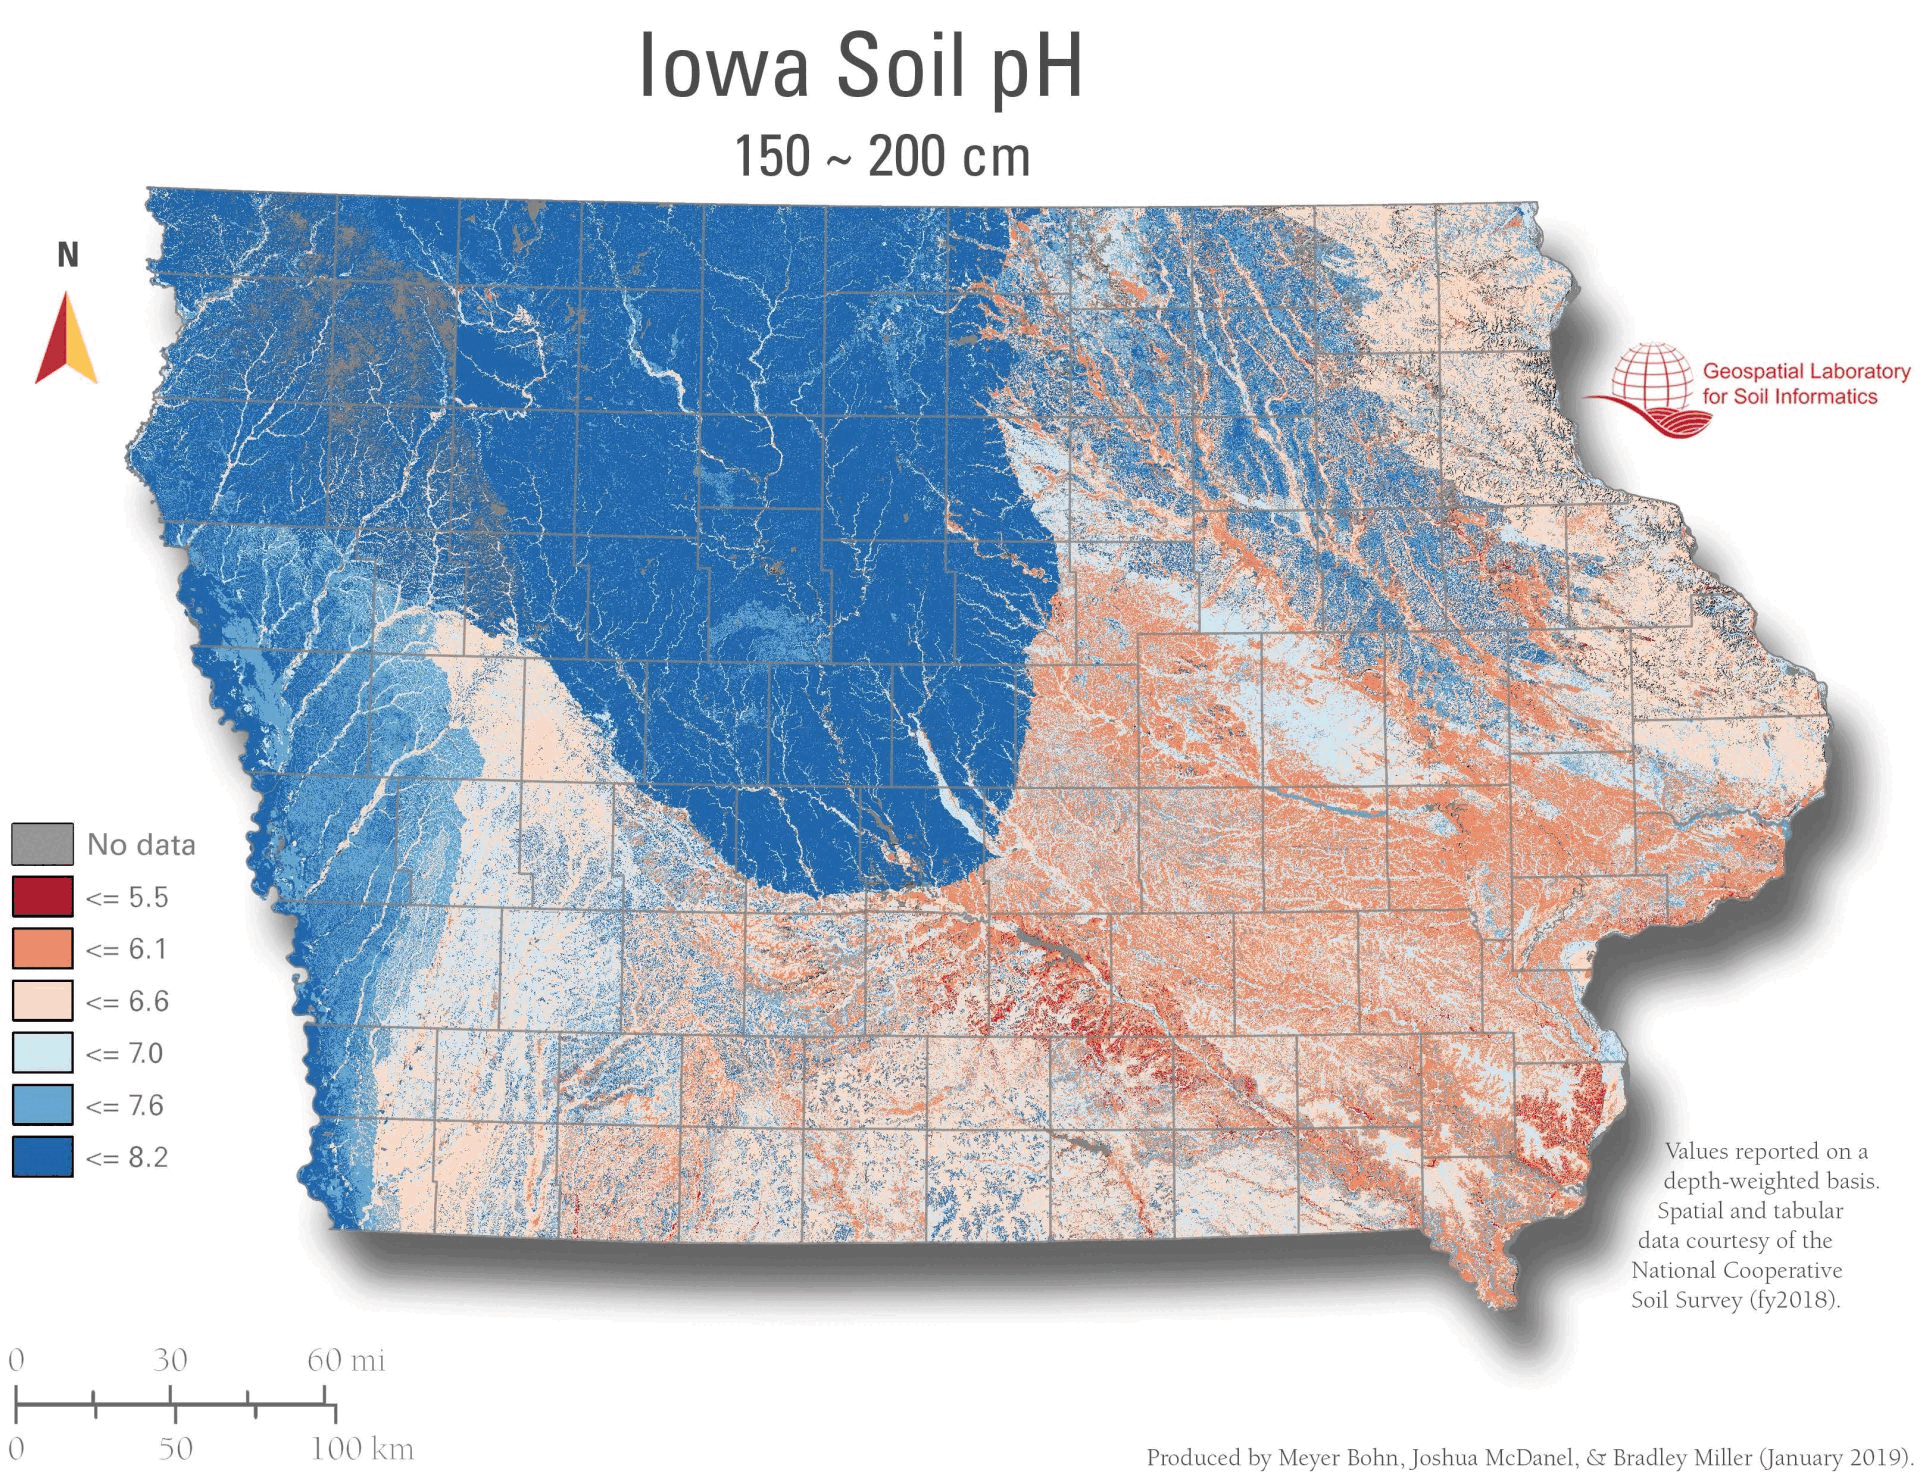
Use these depth-resolved animations to: gauge rooting limits and trafficability (bulk density); estimate infiltration/drainage potential (saturated hydraulic conductivity); evaluate drought storage and wetness risk (available water-holding capacity, water storage/content, depth to water table); target pH/lime management; and spot textural changes (sand/silt/clay) that affect fertility, water movement, and engineering suitability.
Available Properties
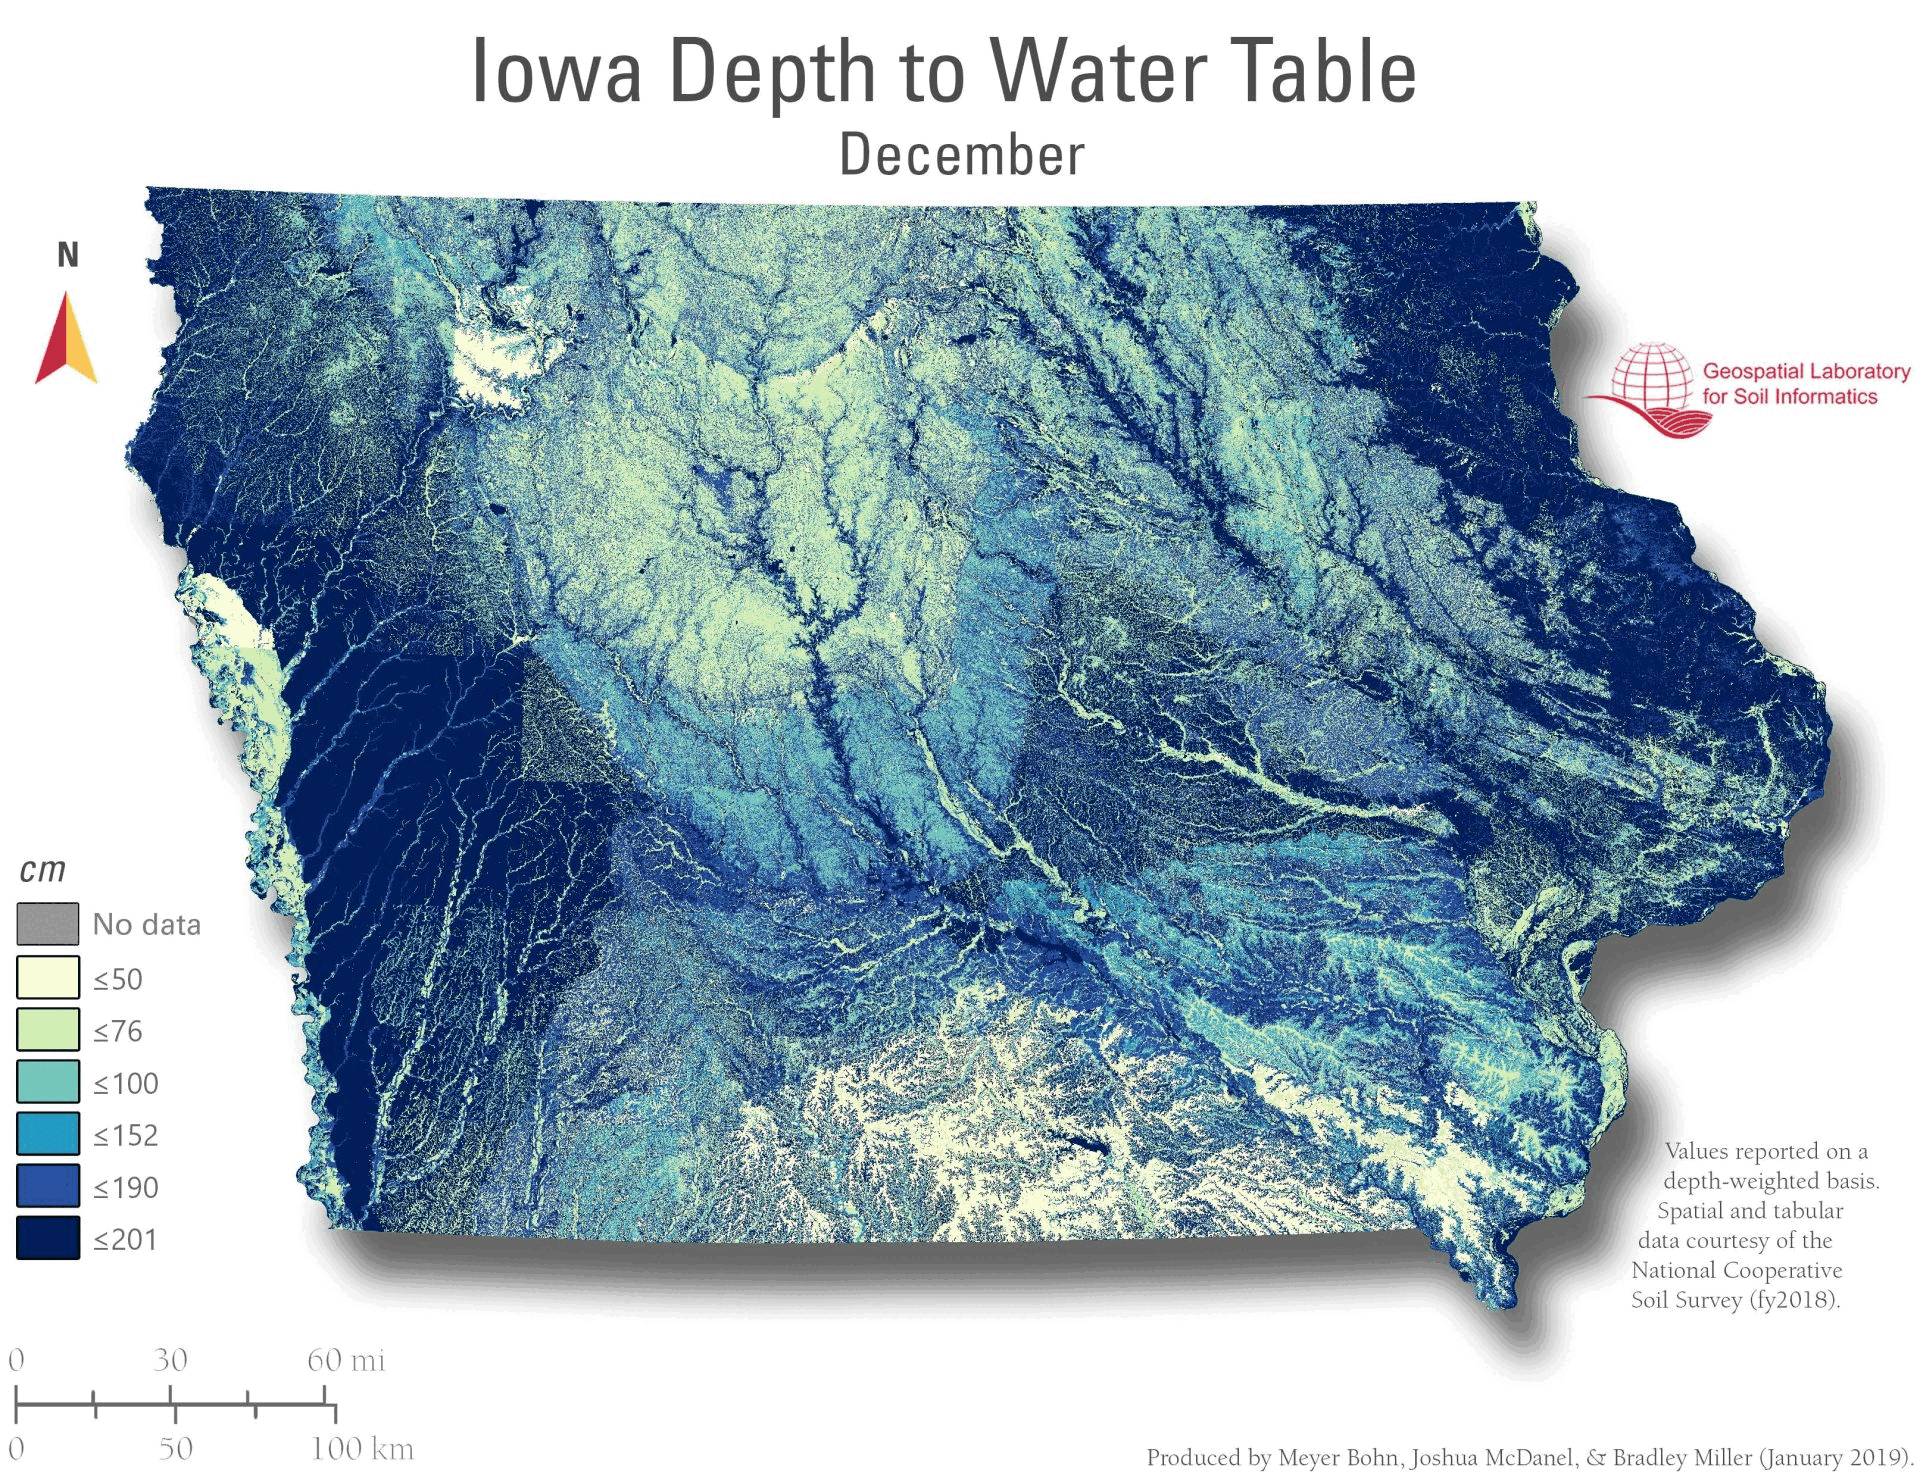
Depth to Water Table (monthly): distance from surface to the saturated zone; shallower depths indicate seasonal wetness risk.
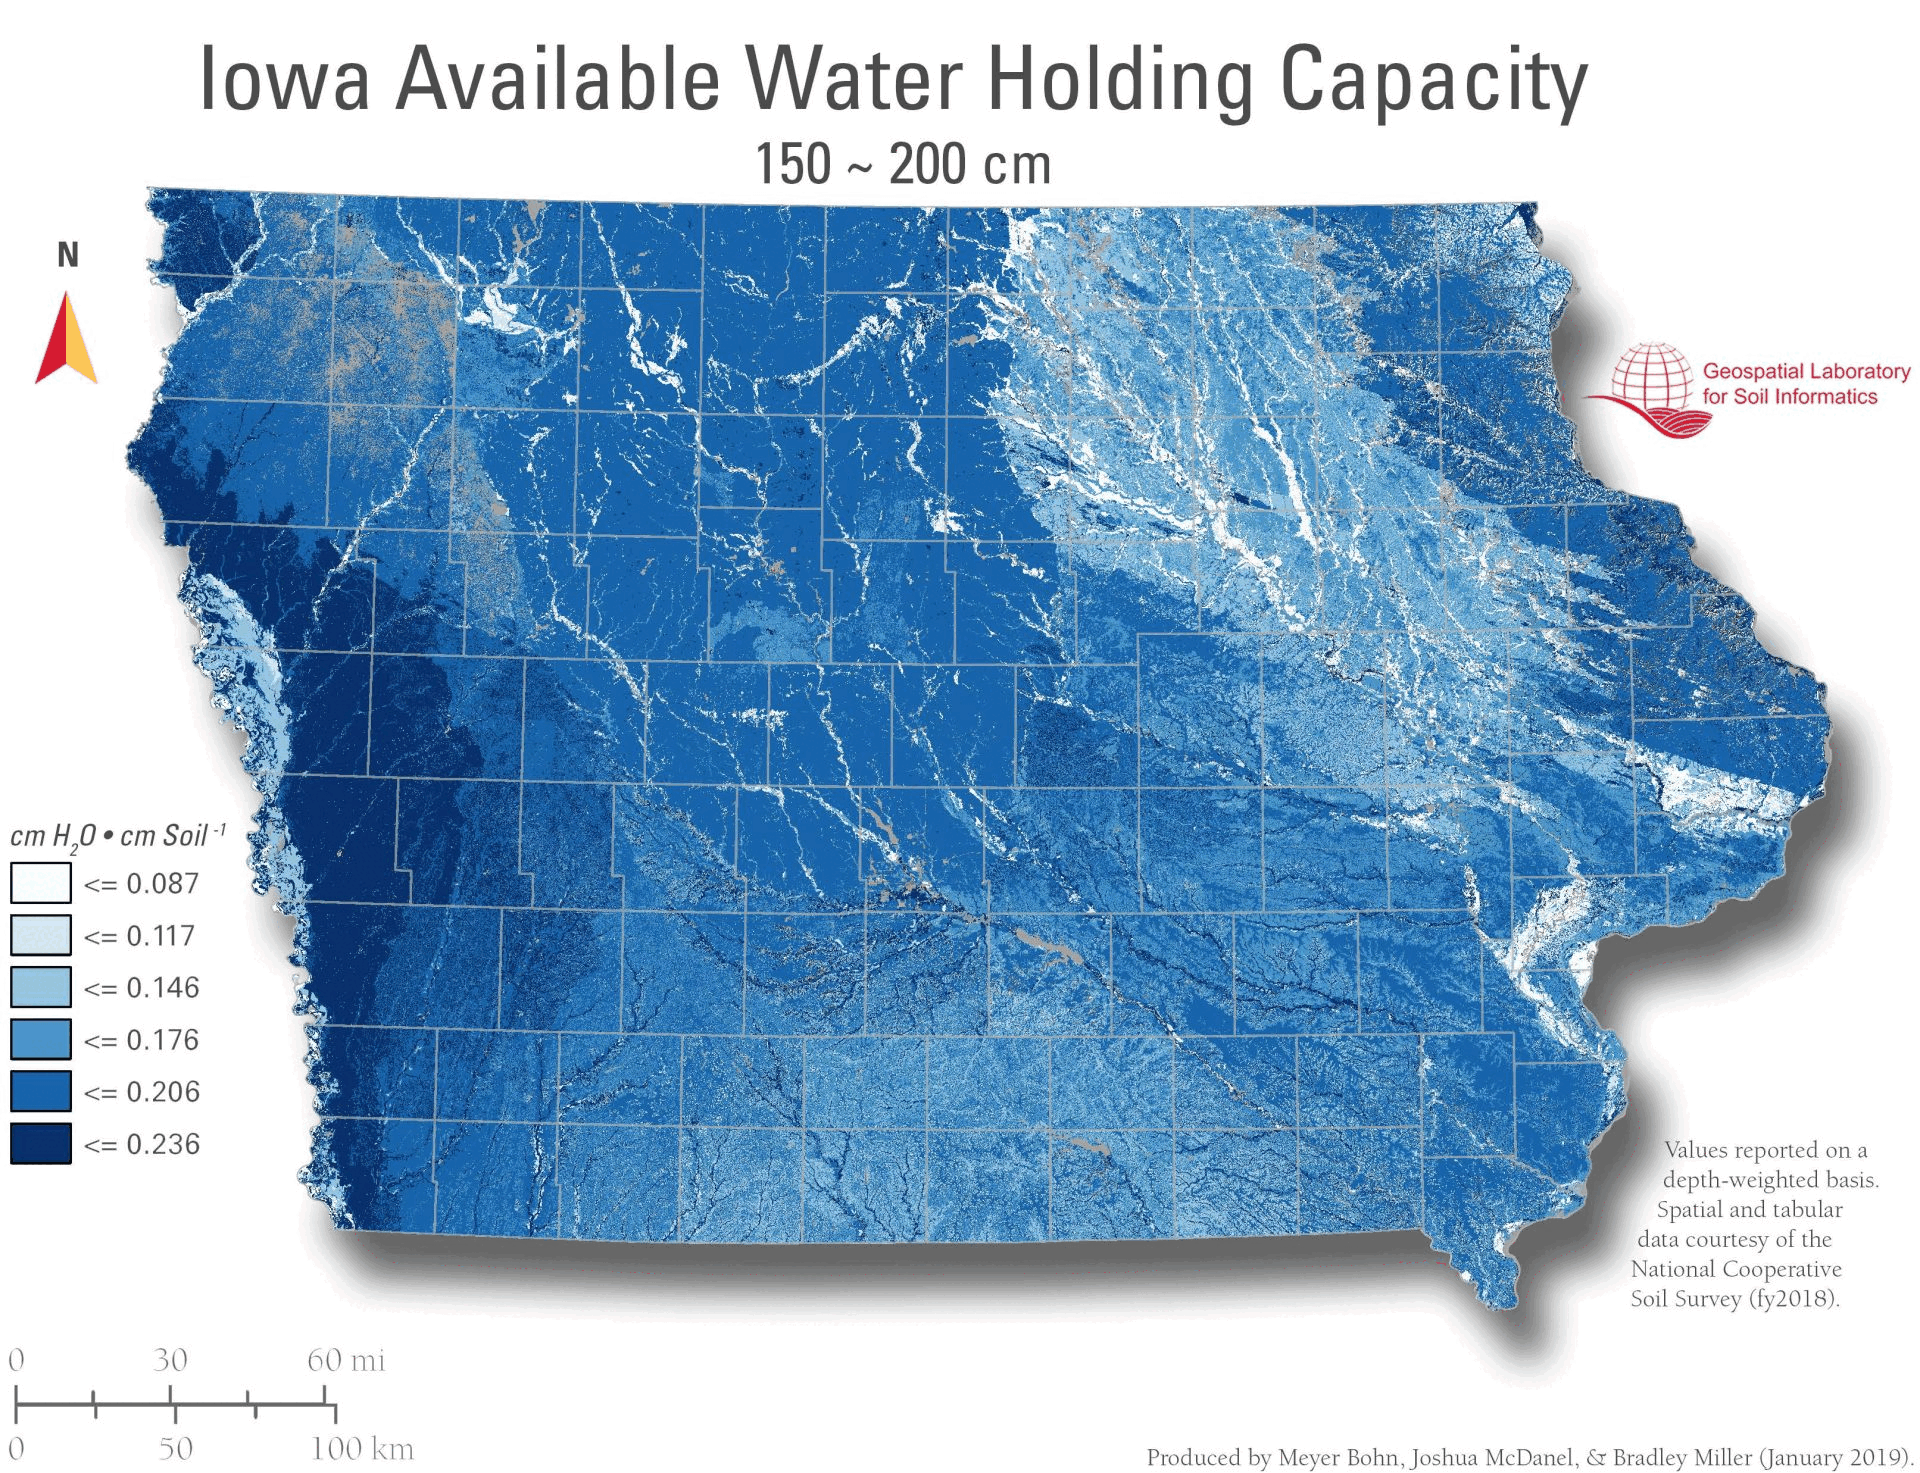
Available Water-Holding Capacity: plant-available water between field capacity and wilting point.
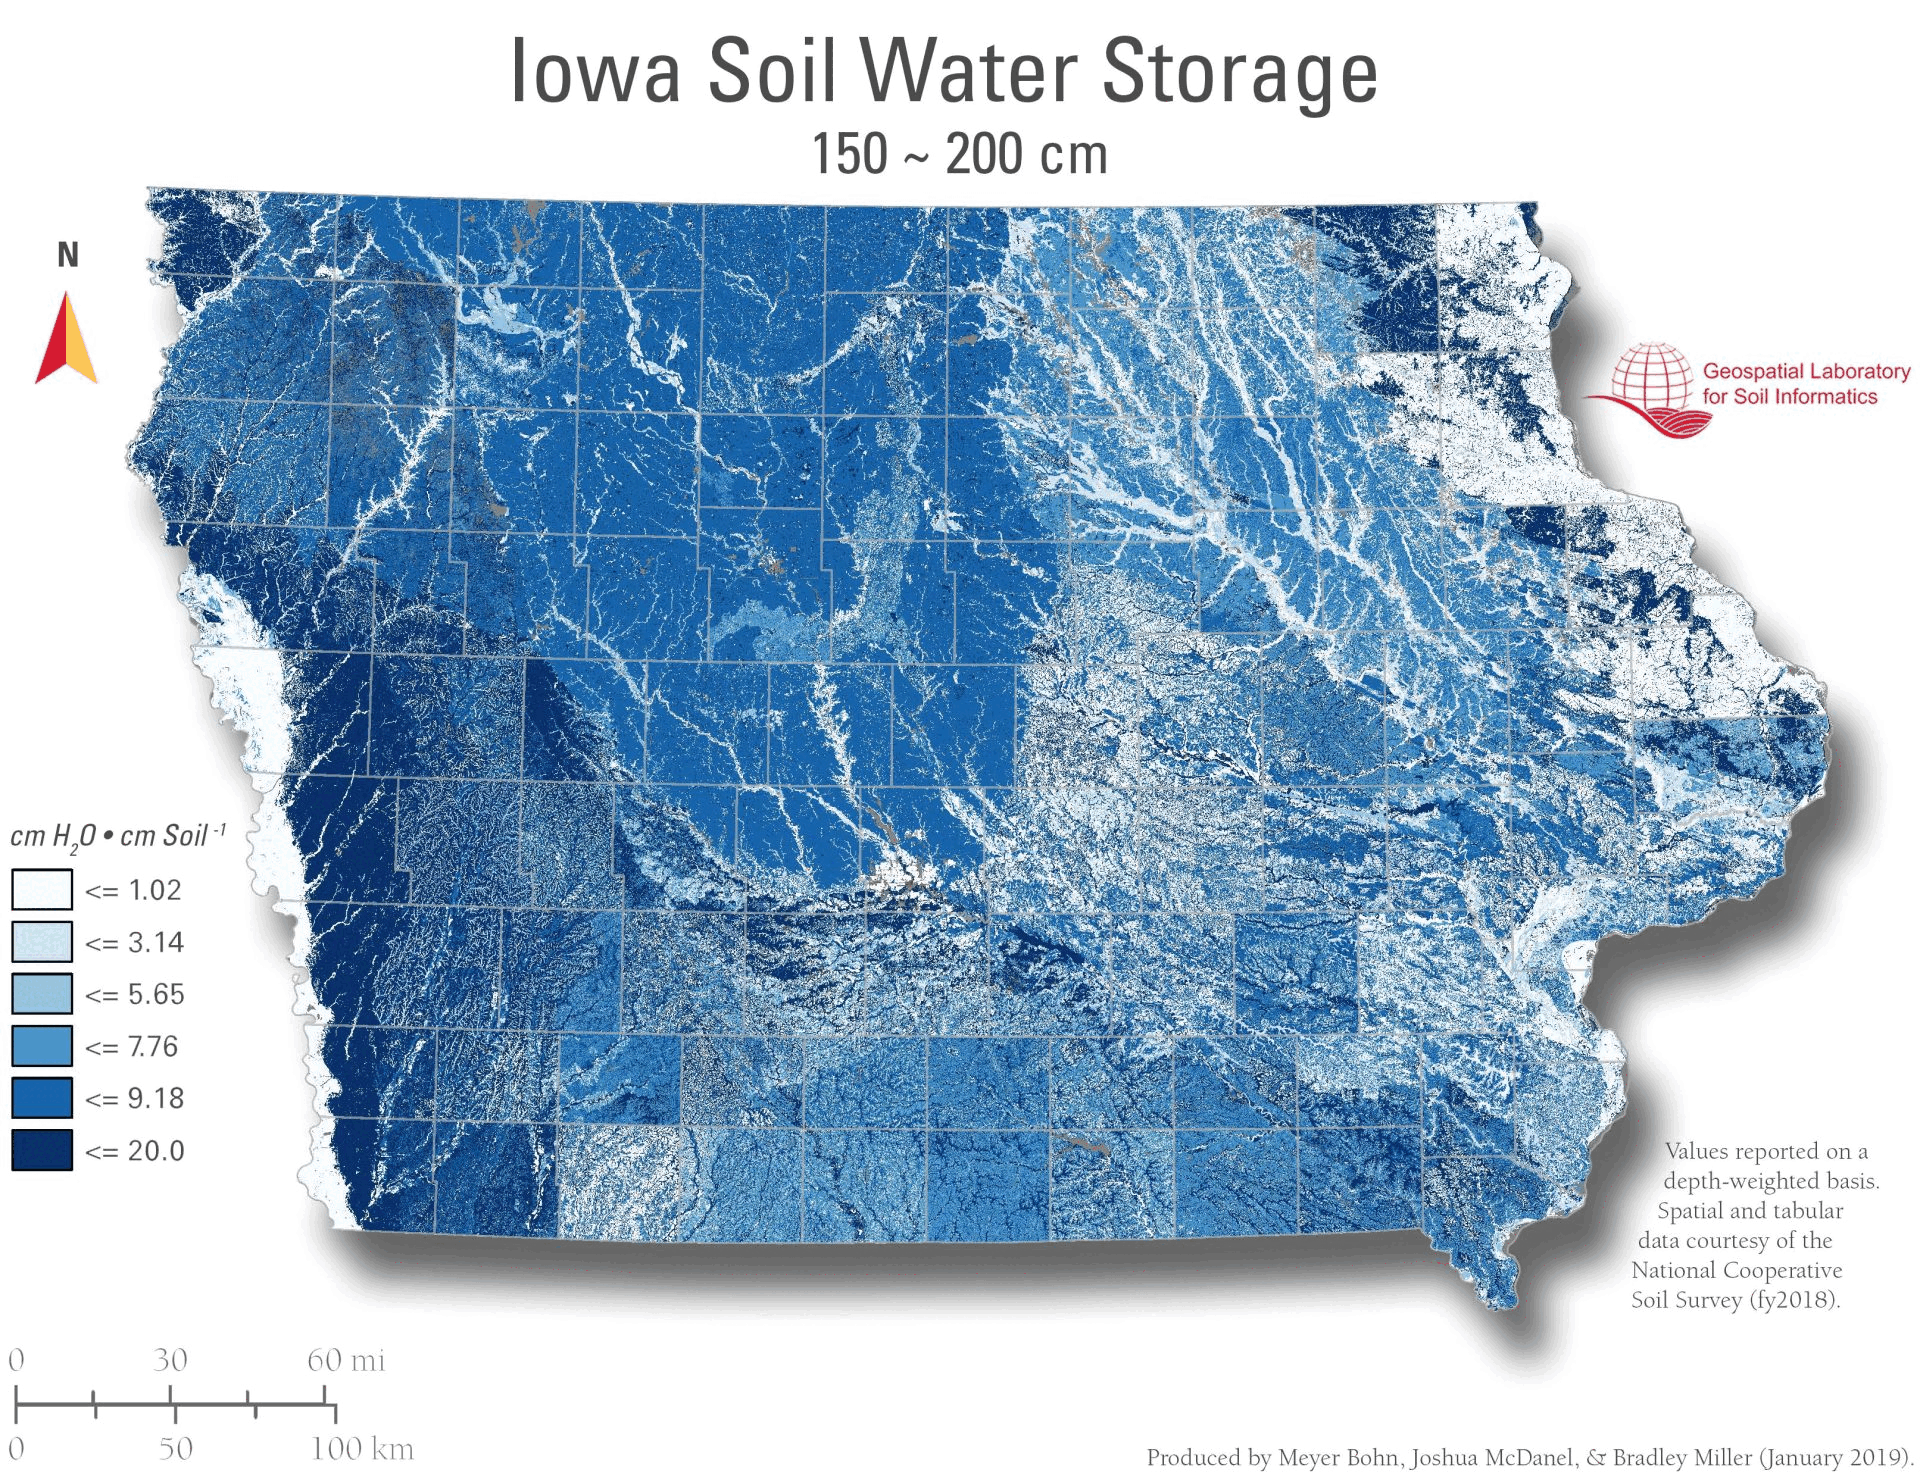
Soil Water Storage / Content (1/3 bar): approximates water near field capacity.
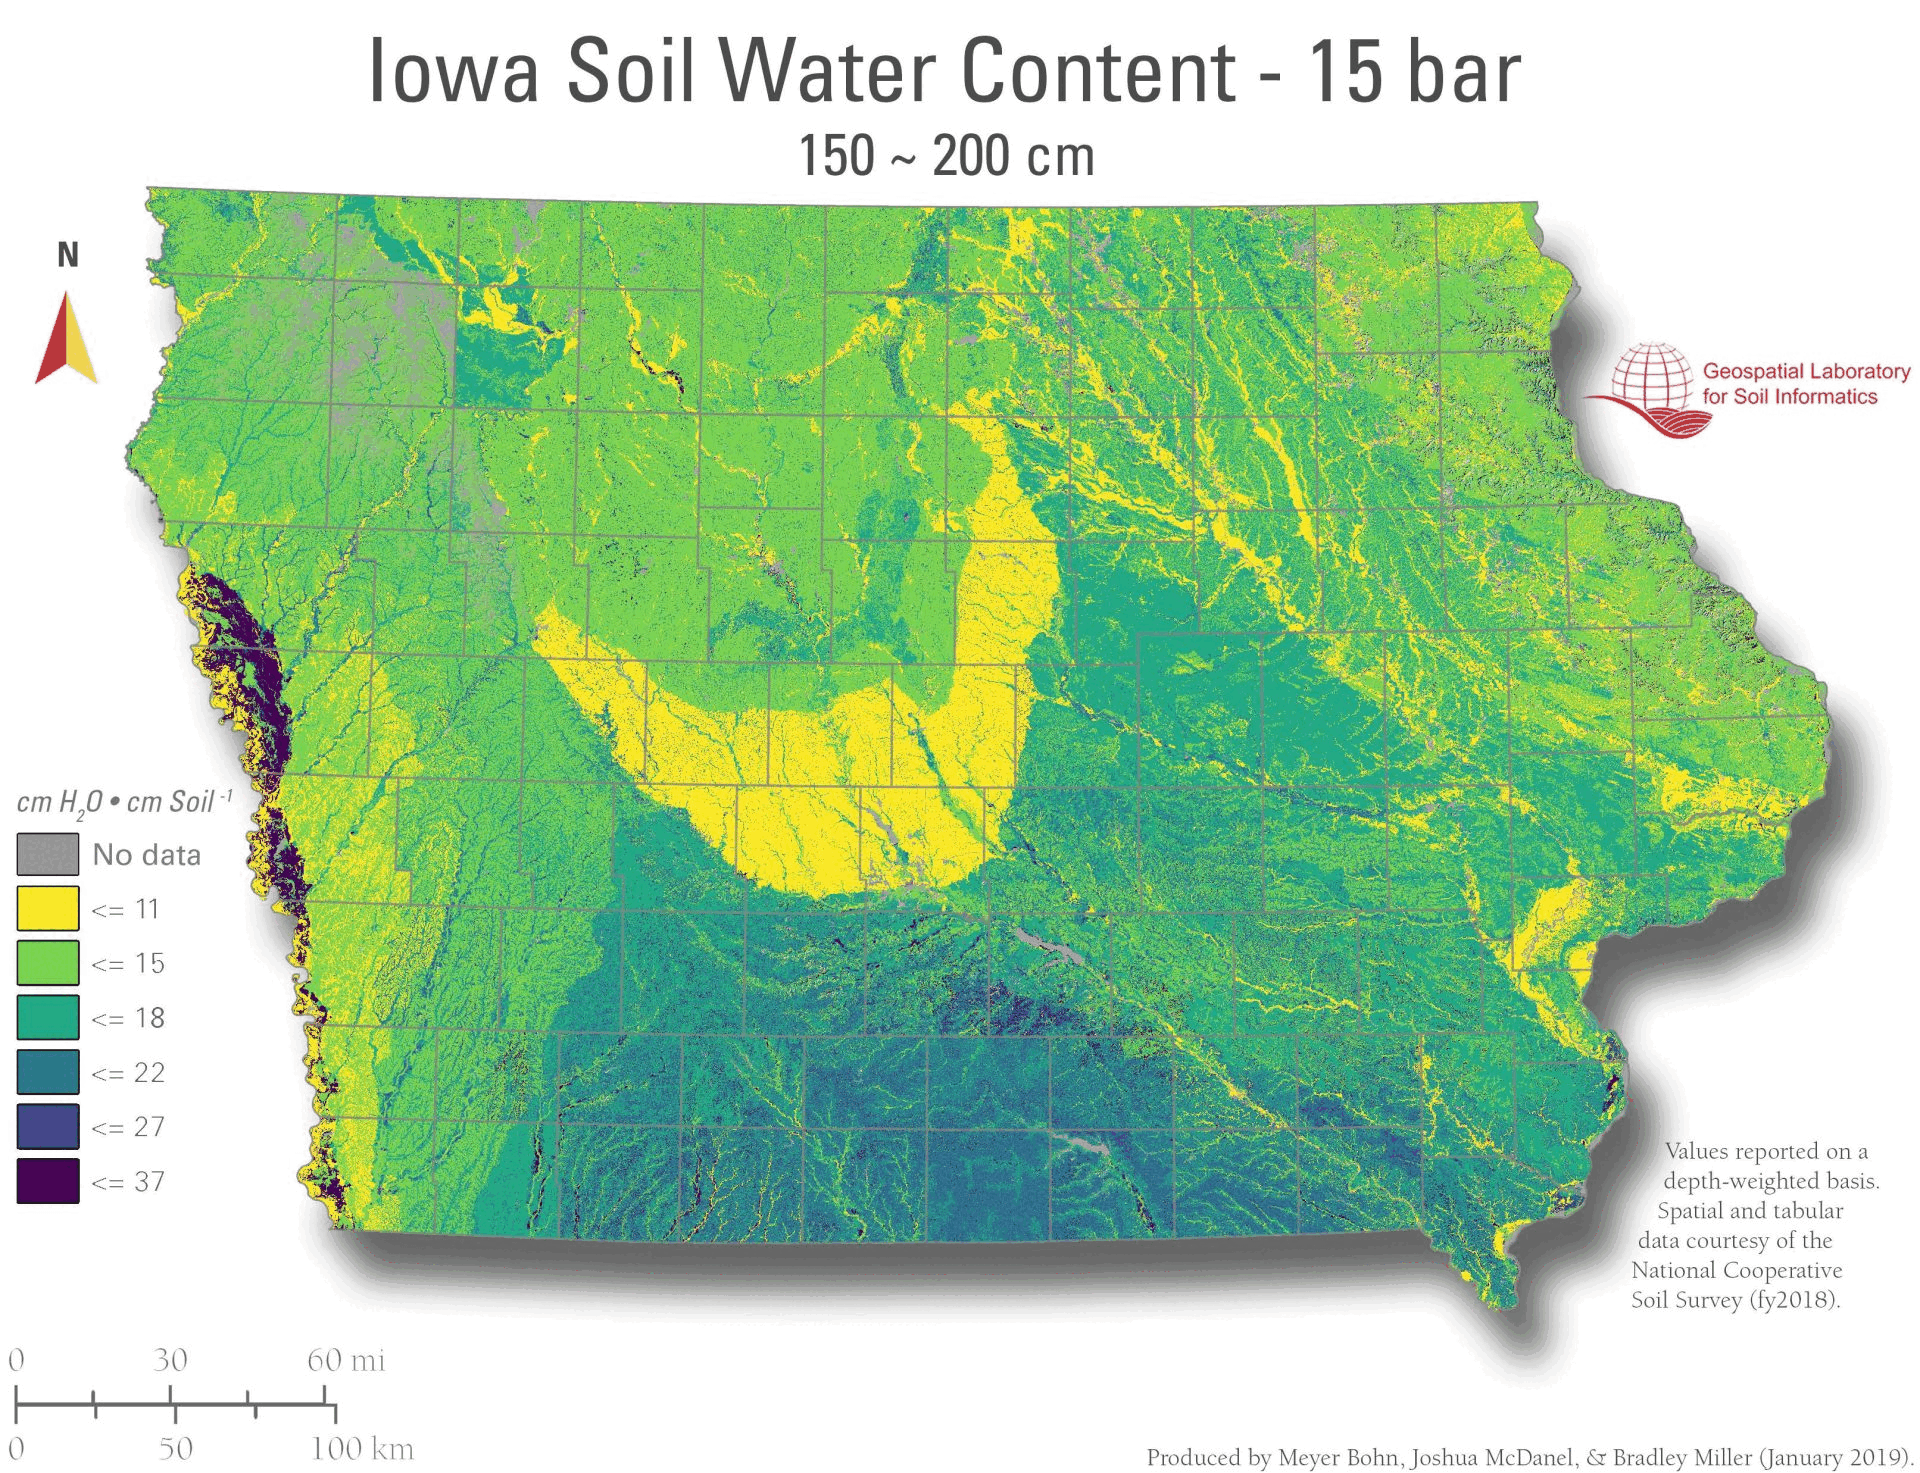
Soil Water Content (15 bar): approximates water at wilting point.
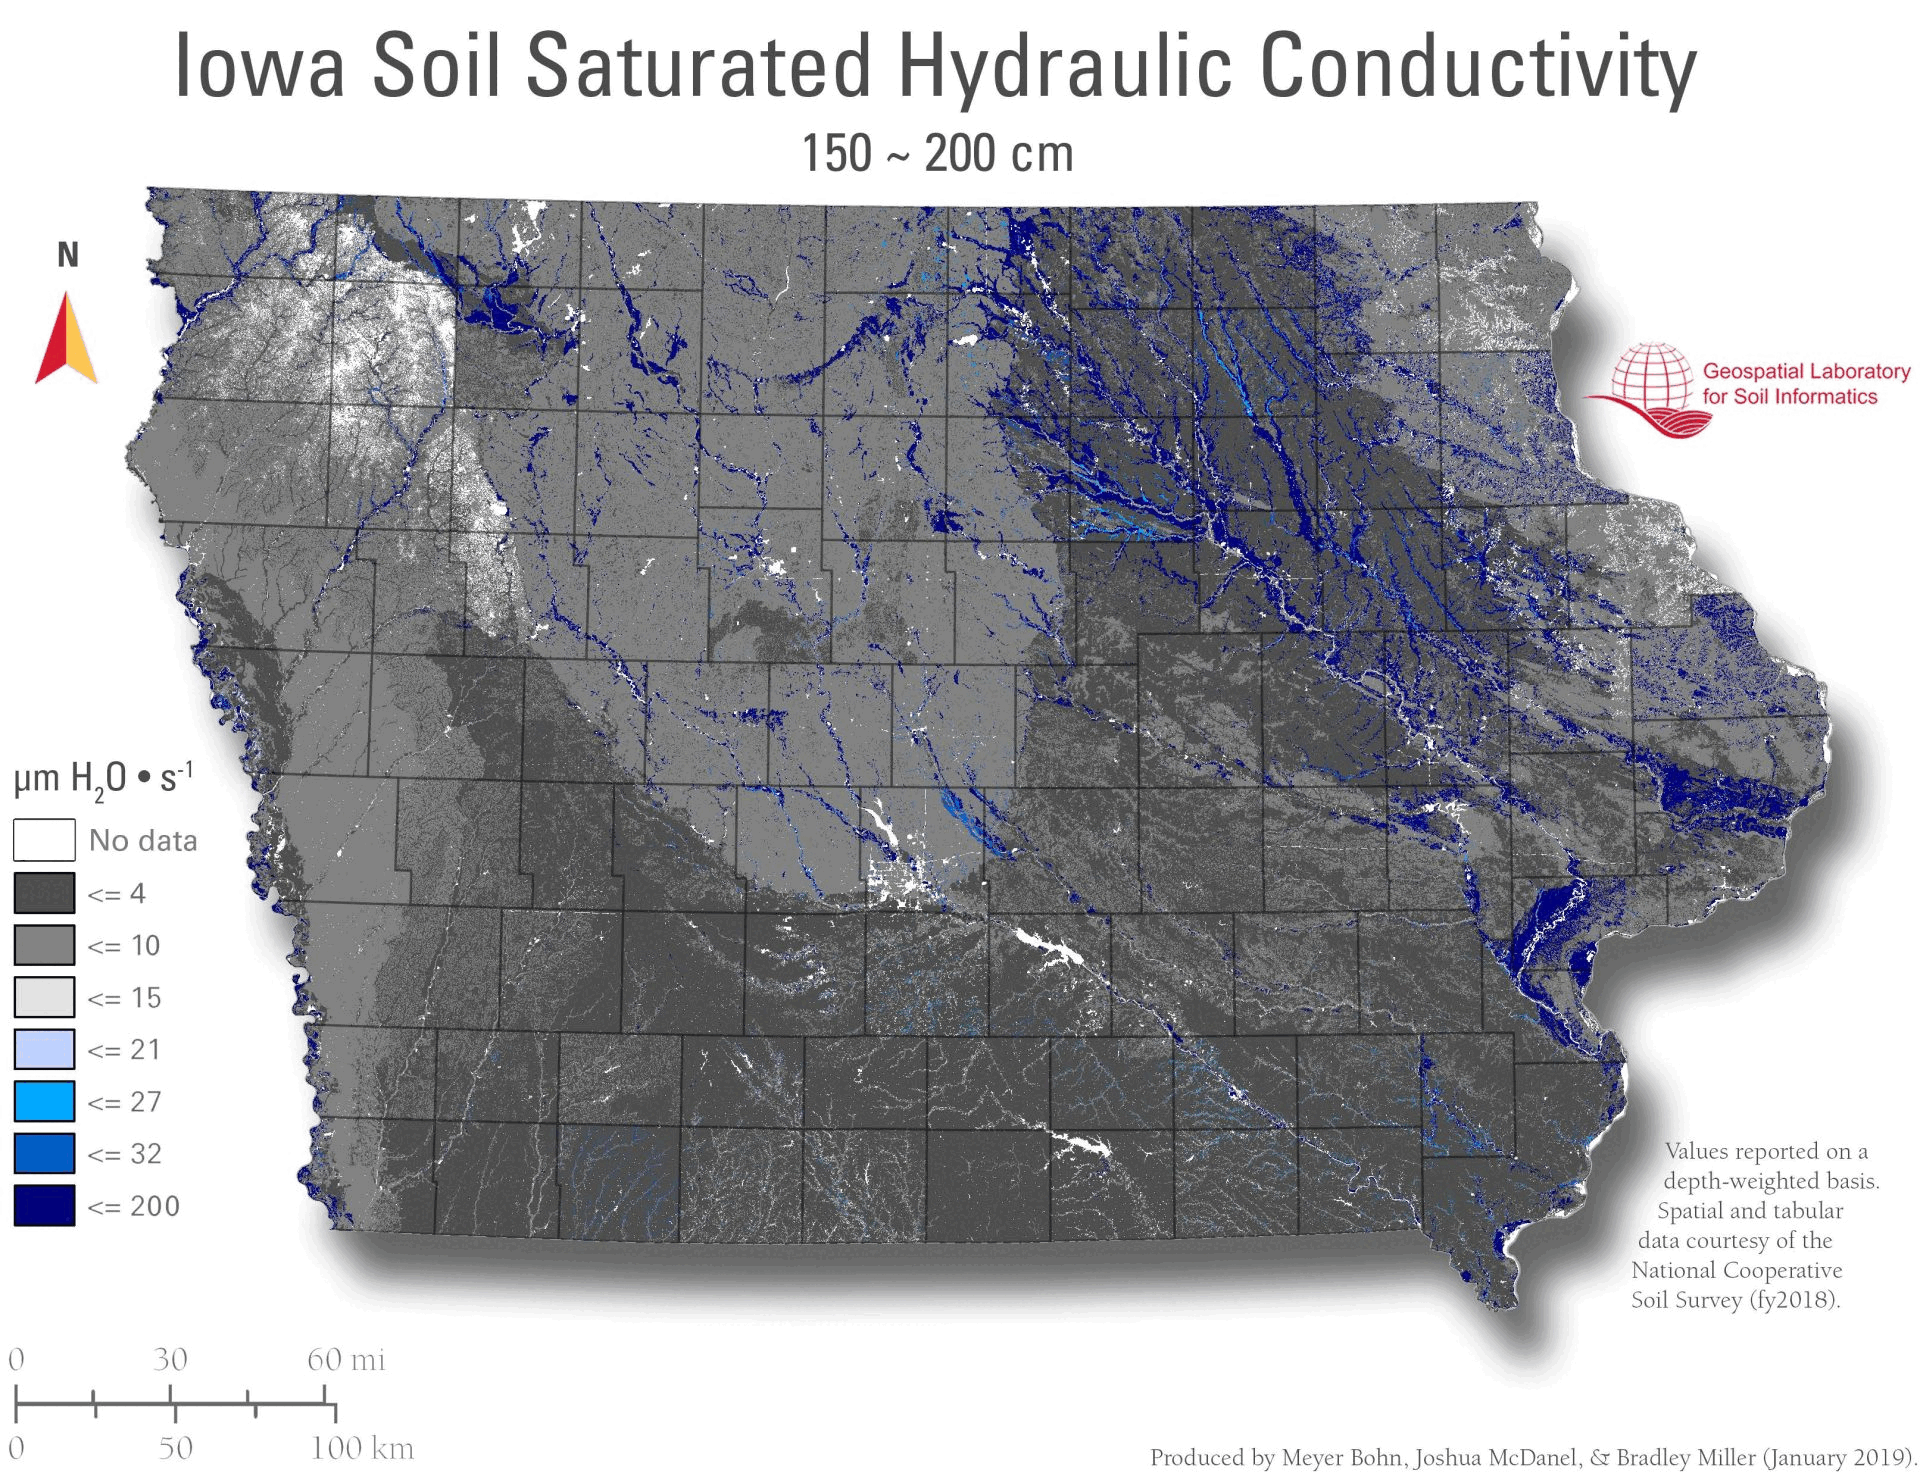
Saturated Hydraulic Conductivity (Ksat): potential infiltration/drainage rate under saturation.
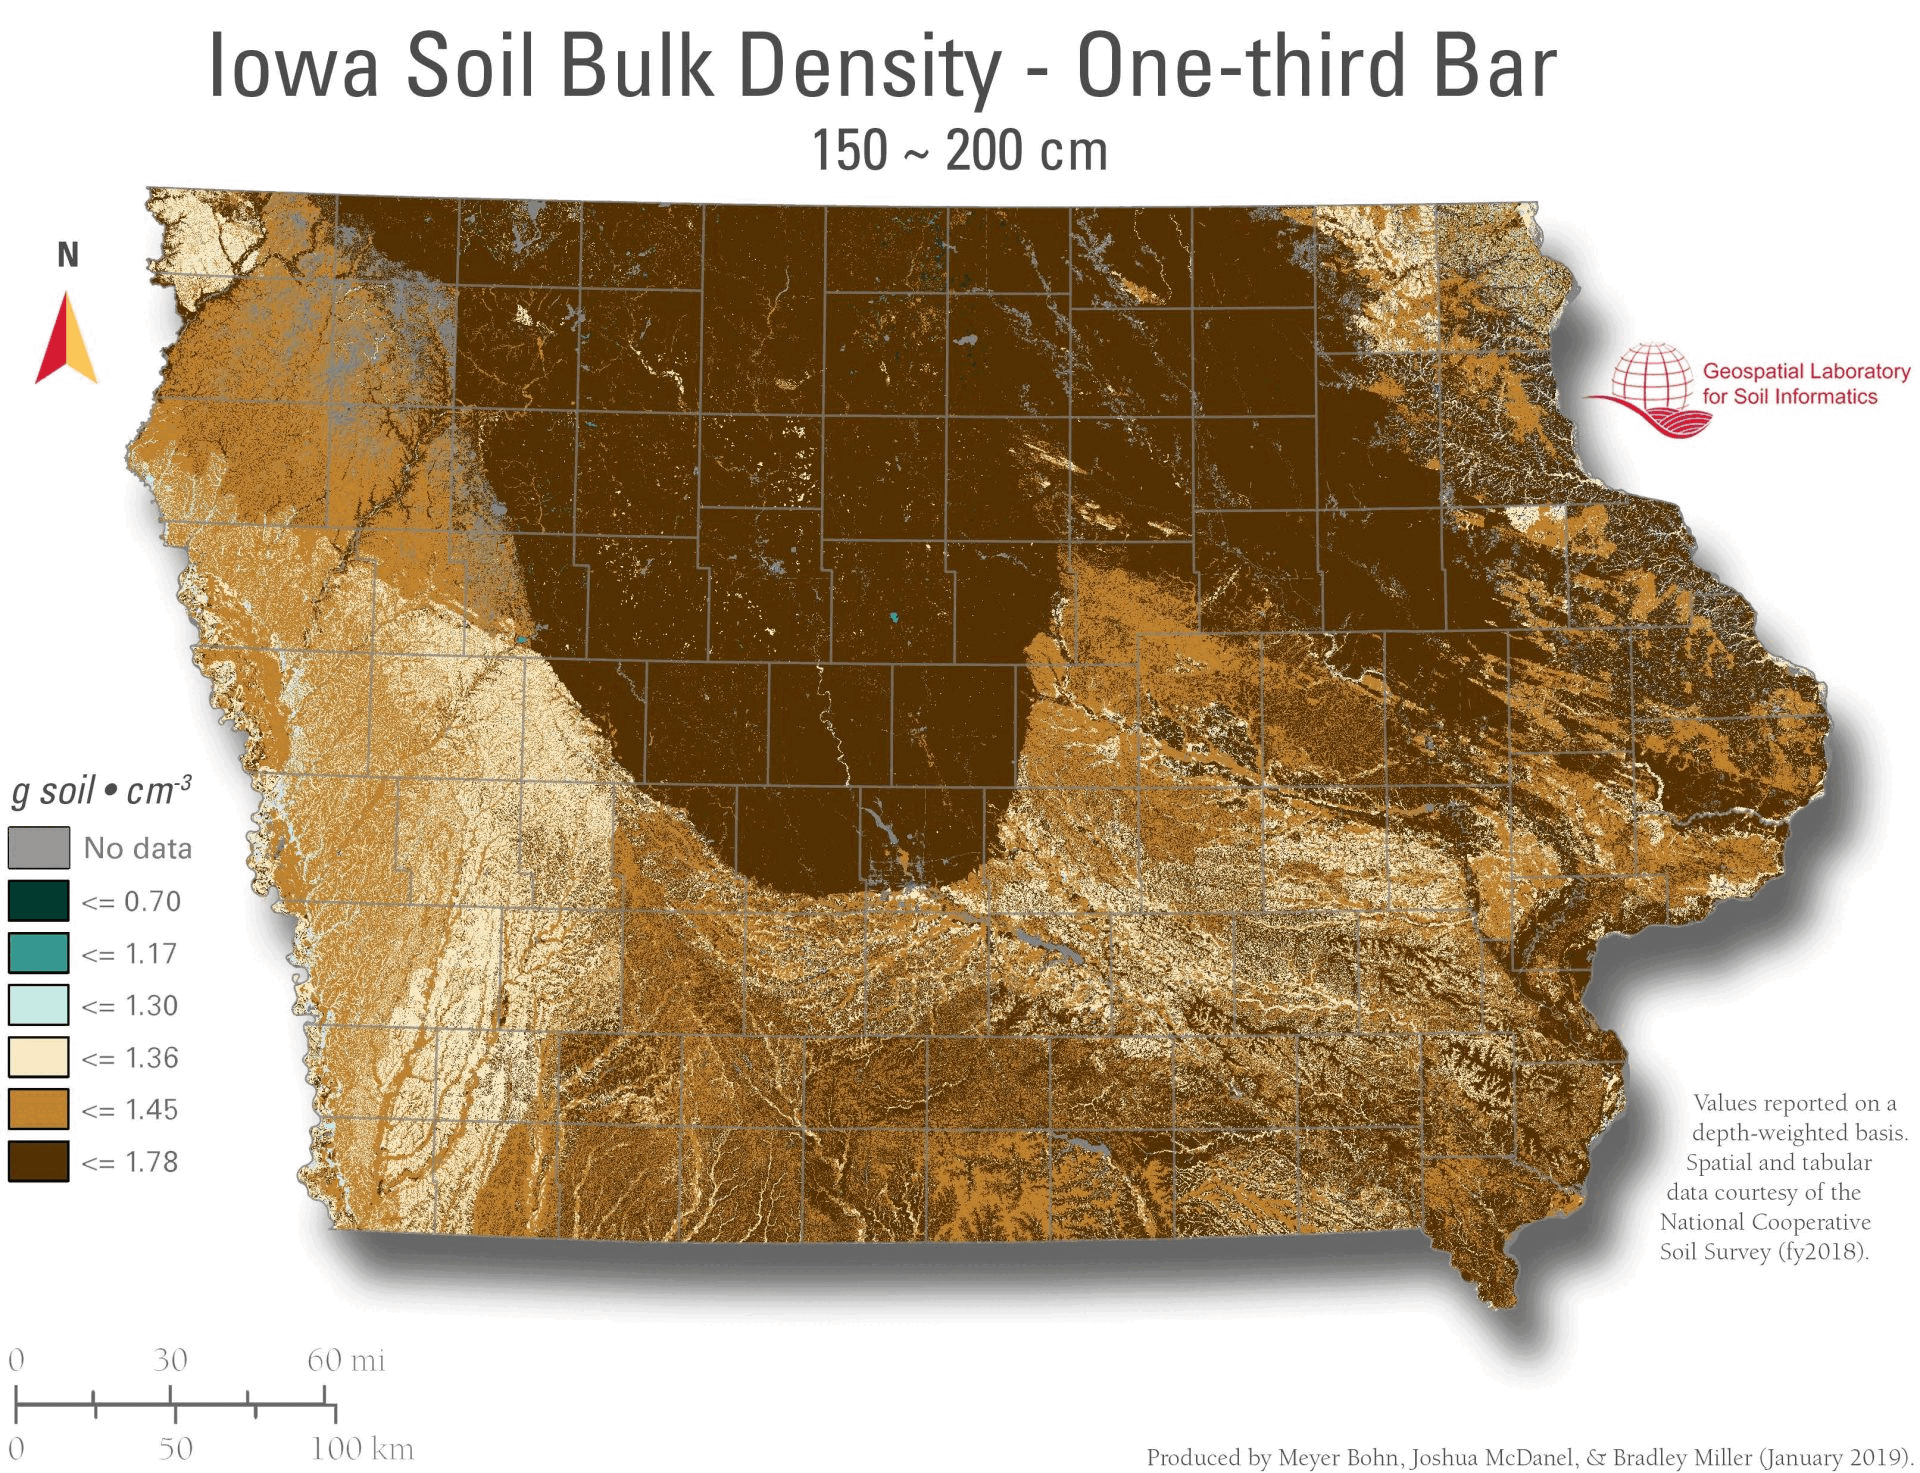
Bulk Density (1/3 bar): soil mass per volume near field capacity; relates to compaction and root growth.
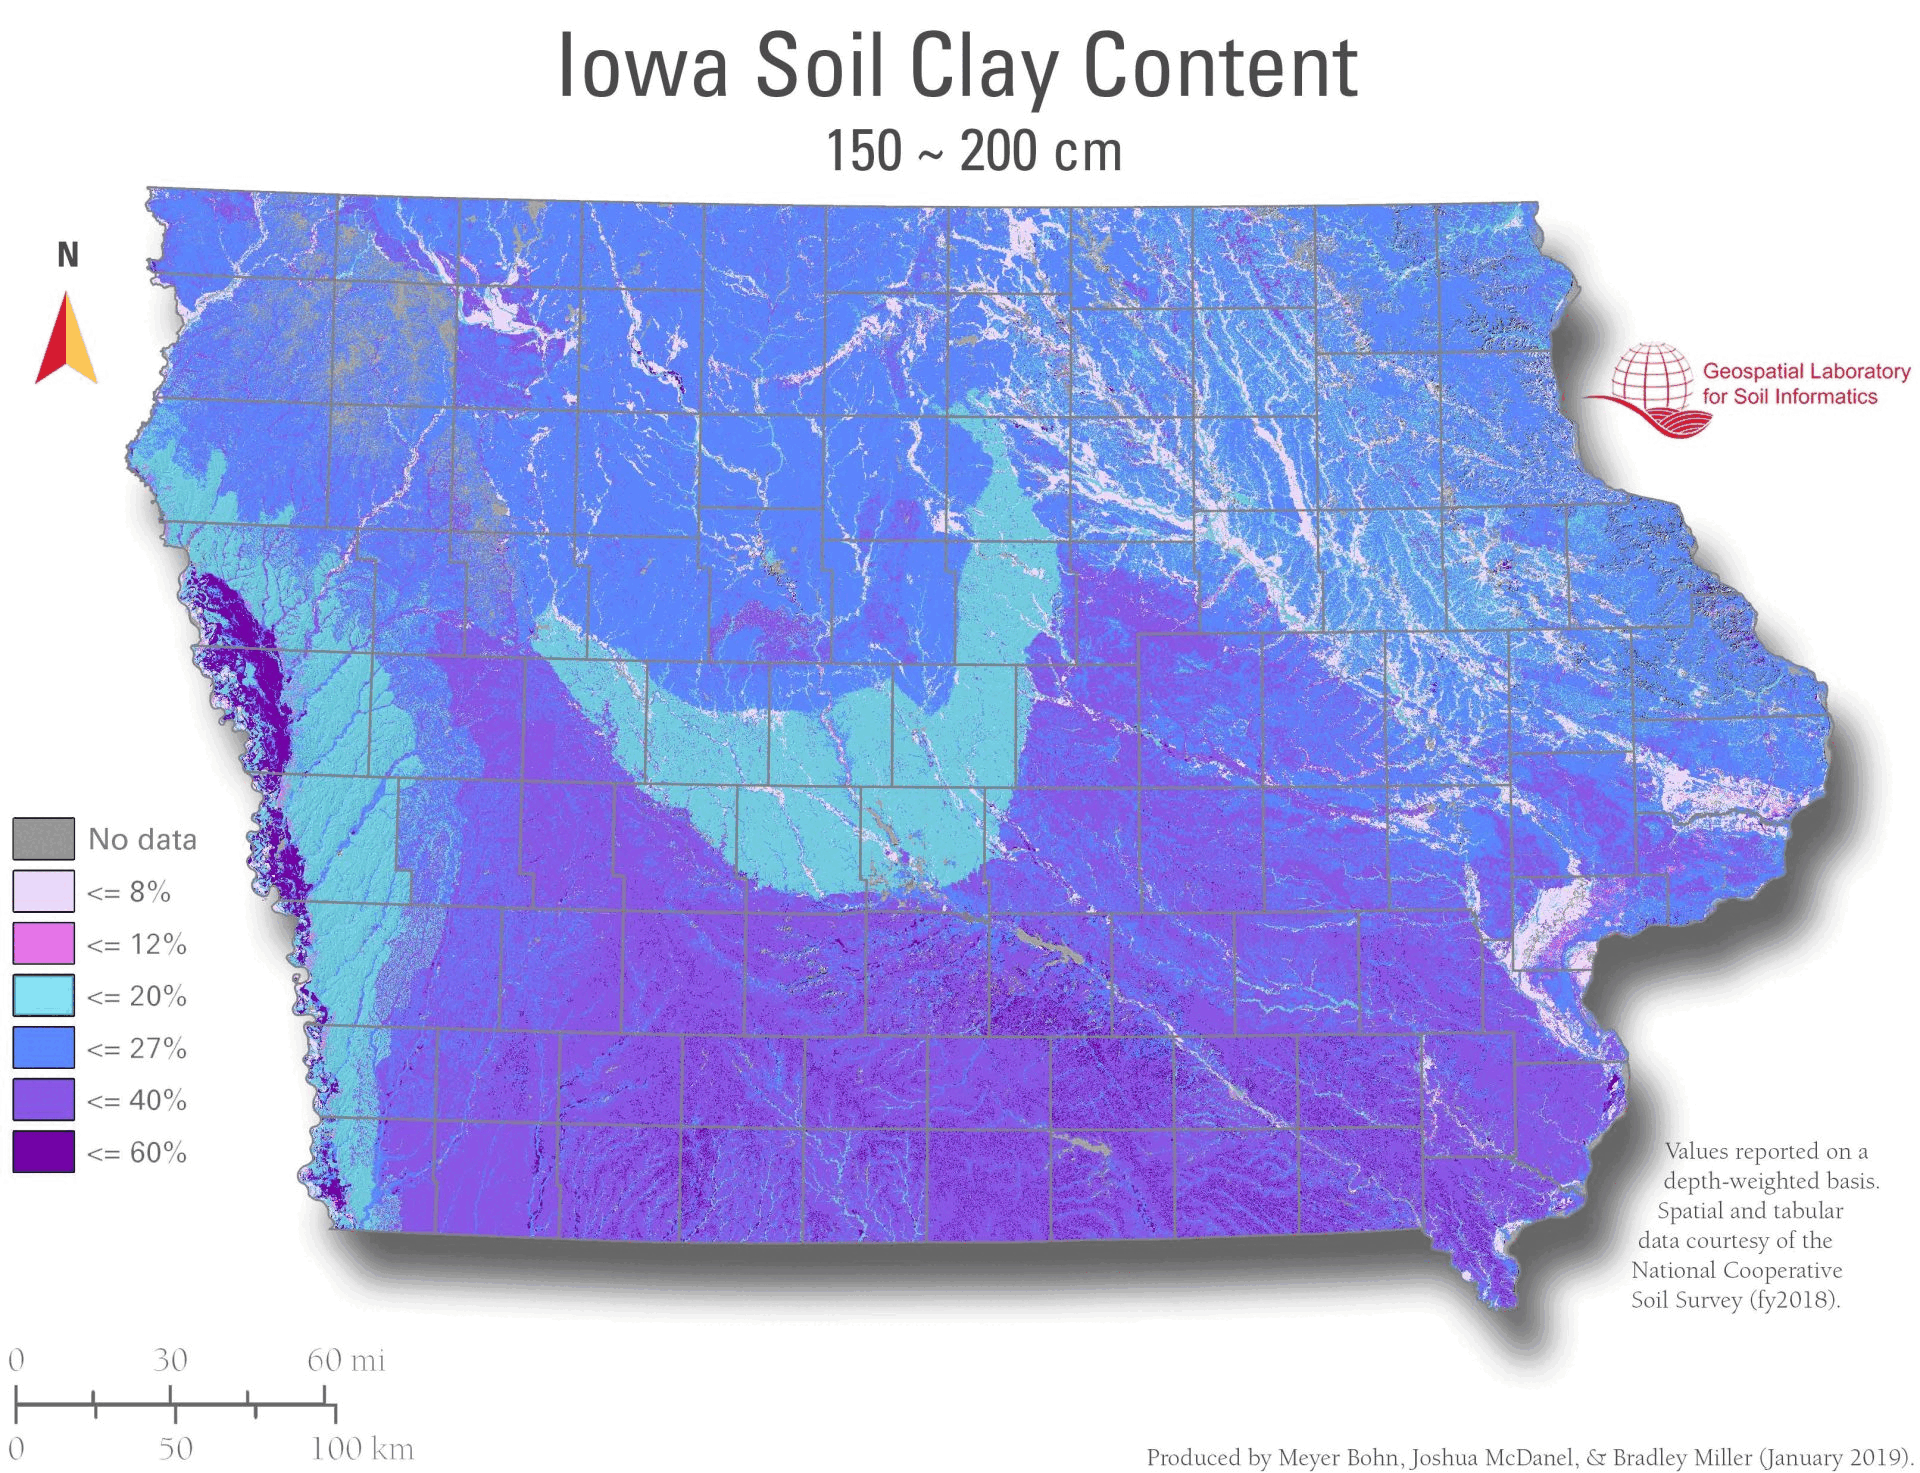
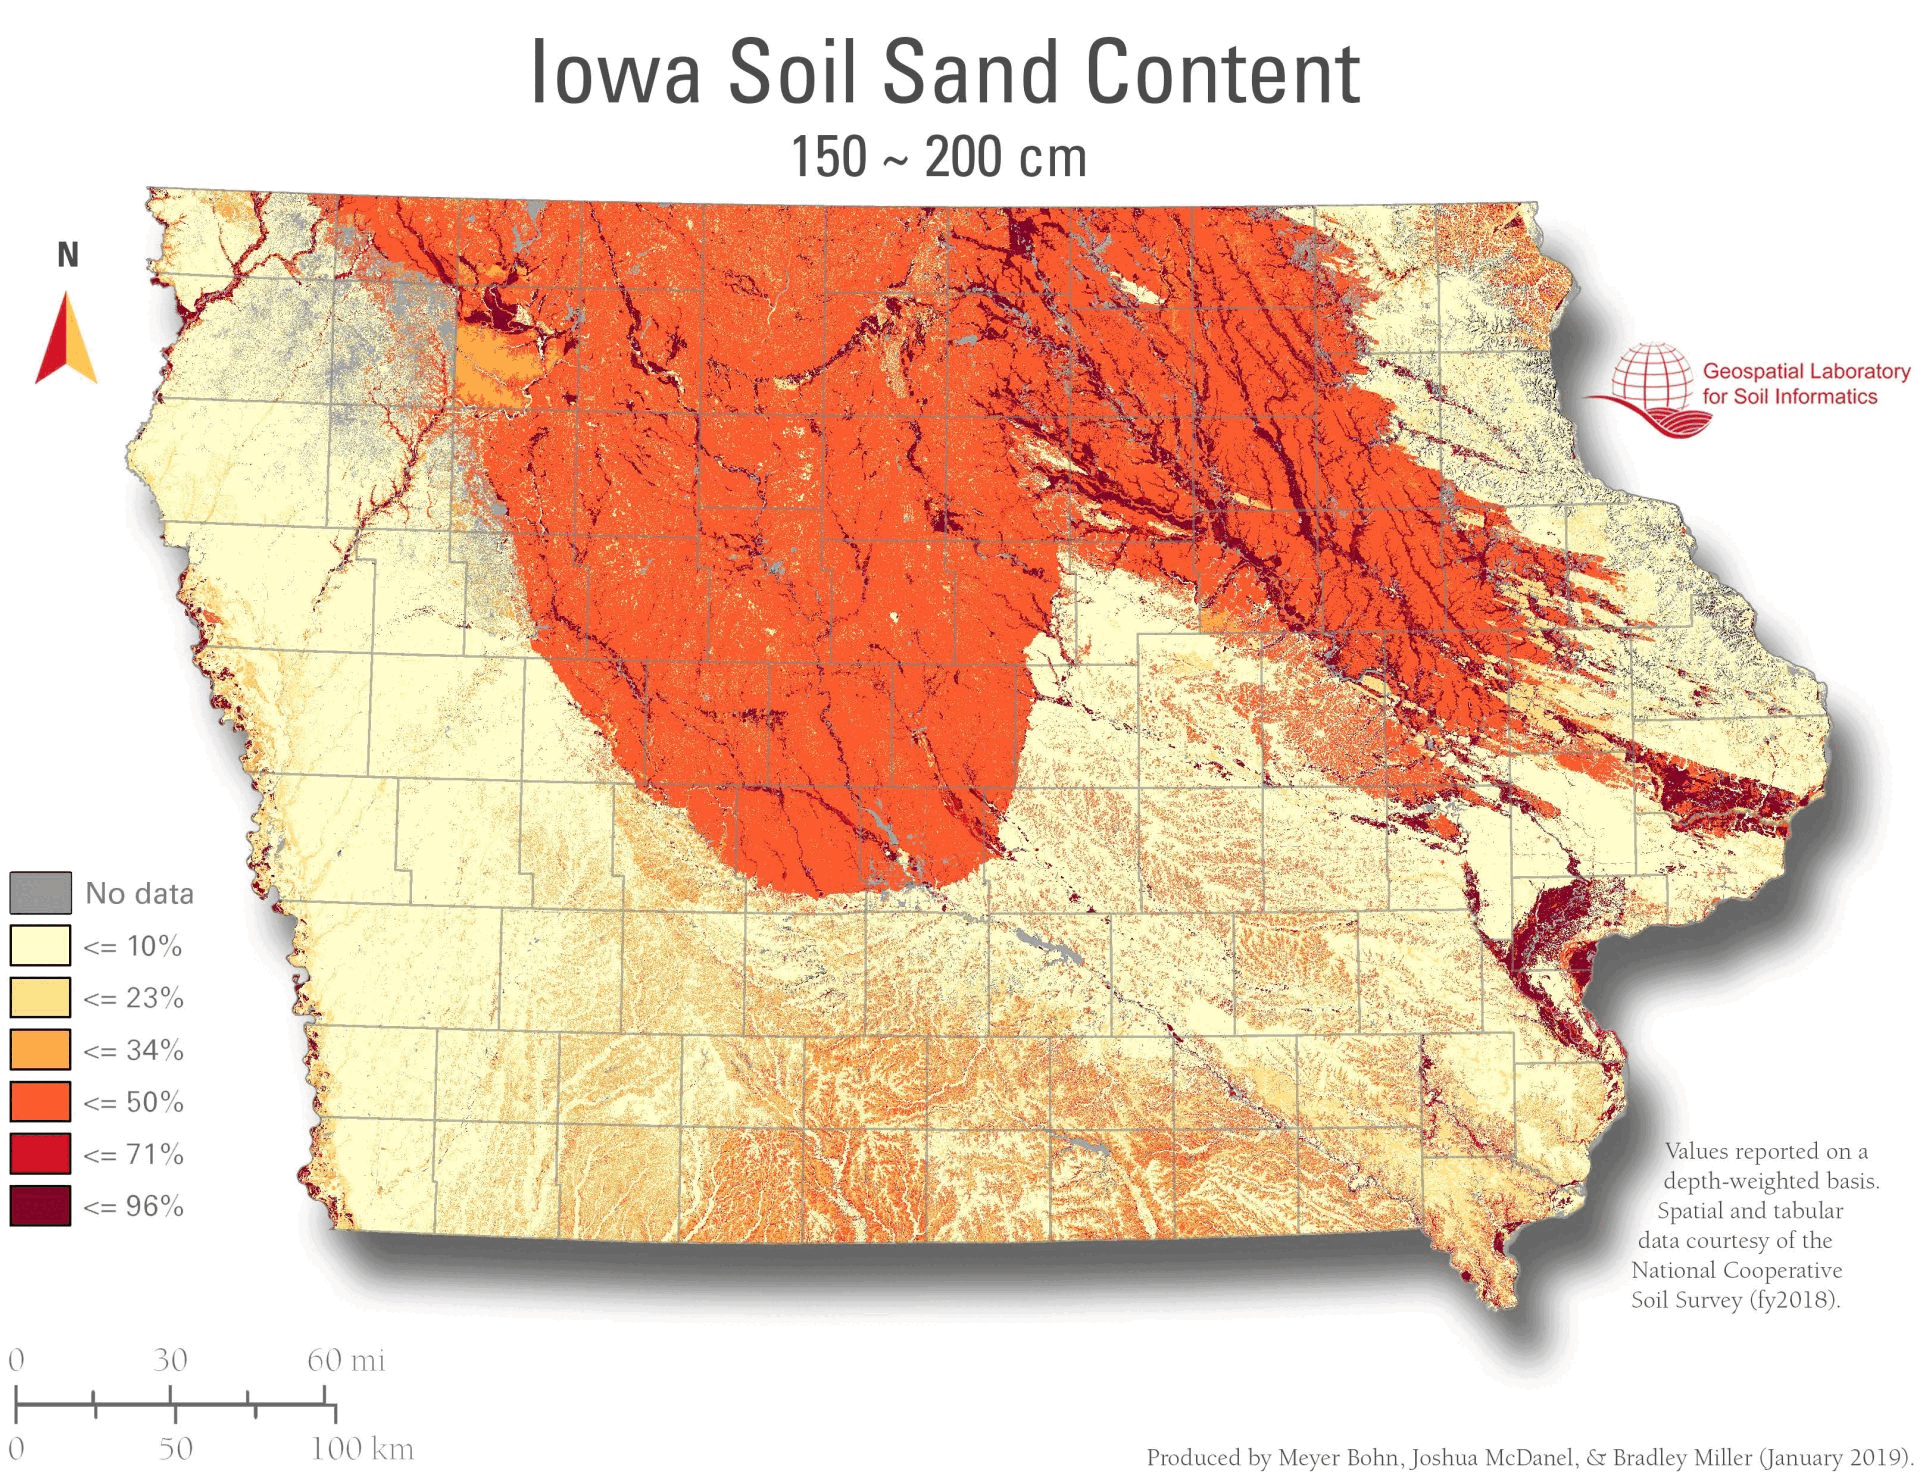
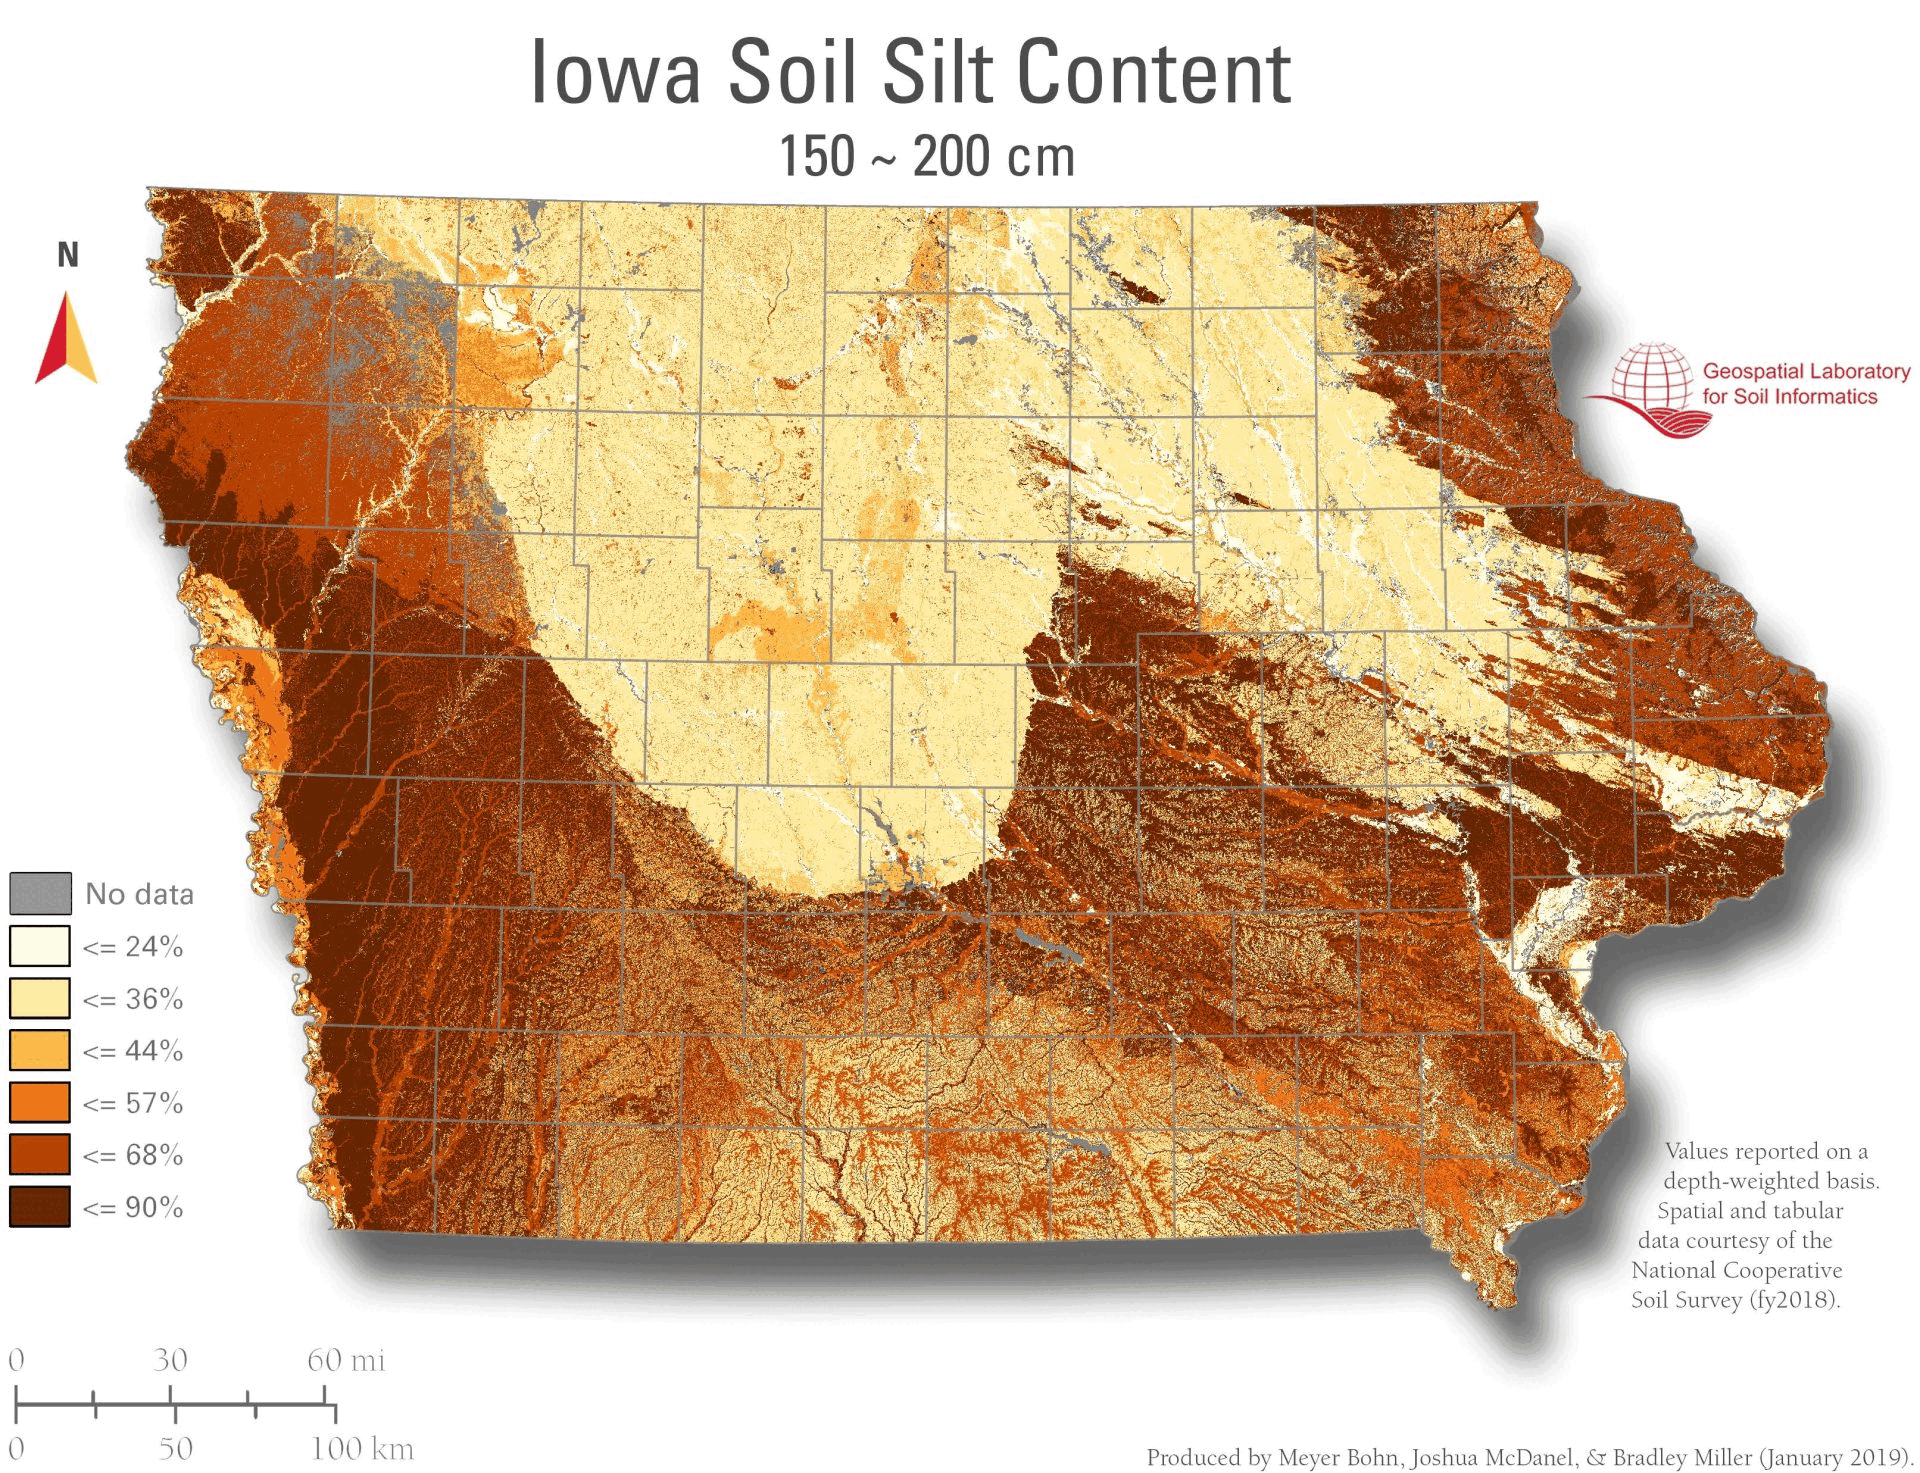
Clay Content / Sand Content: particle-size fractions that drive water, nutrient, and engineering behavior.
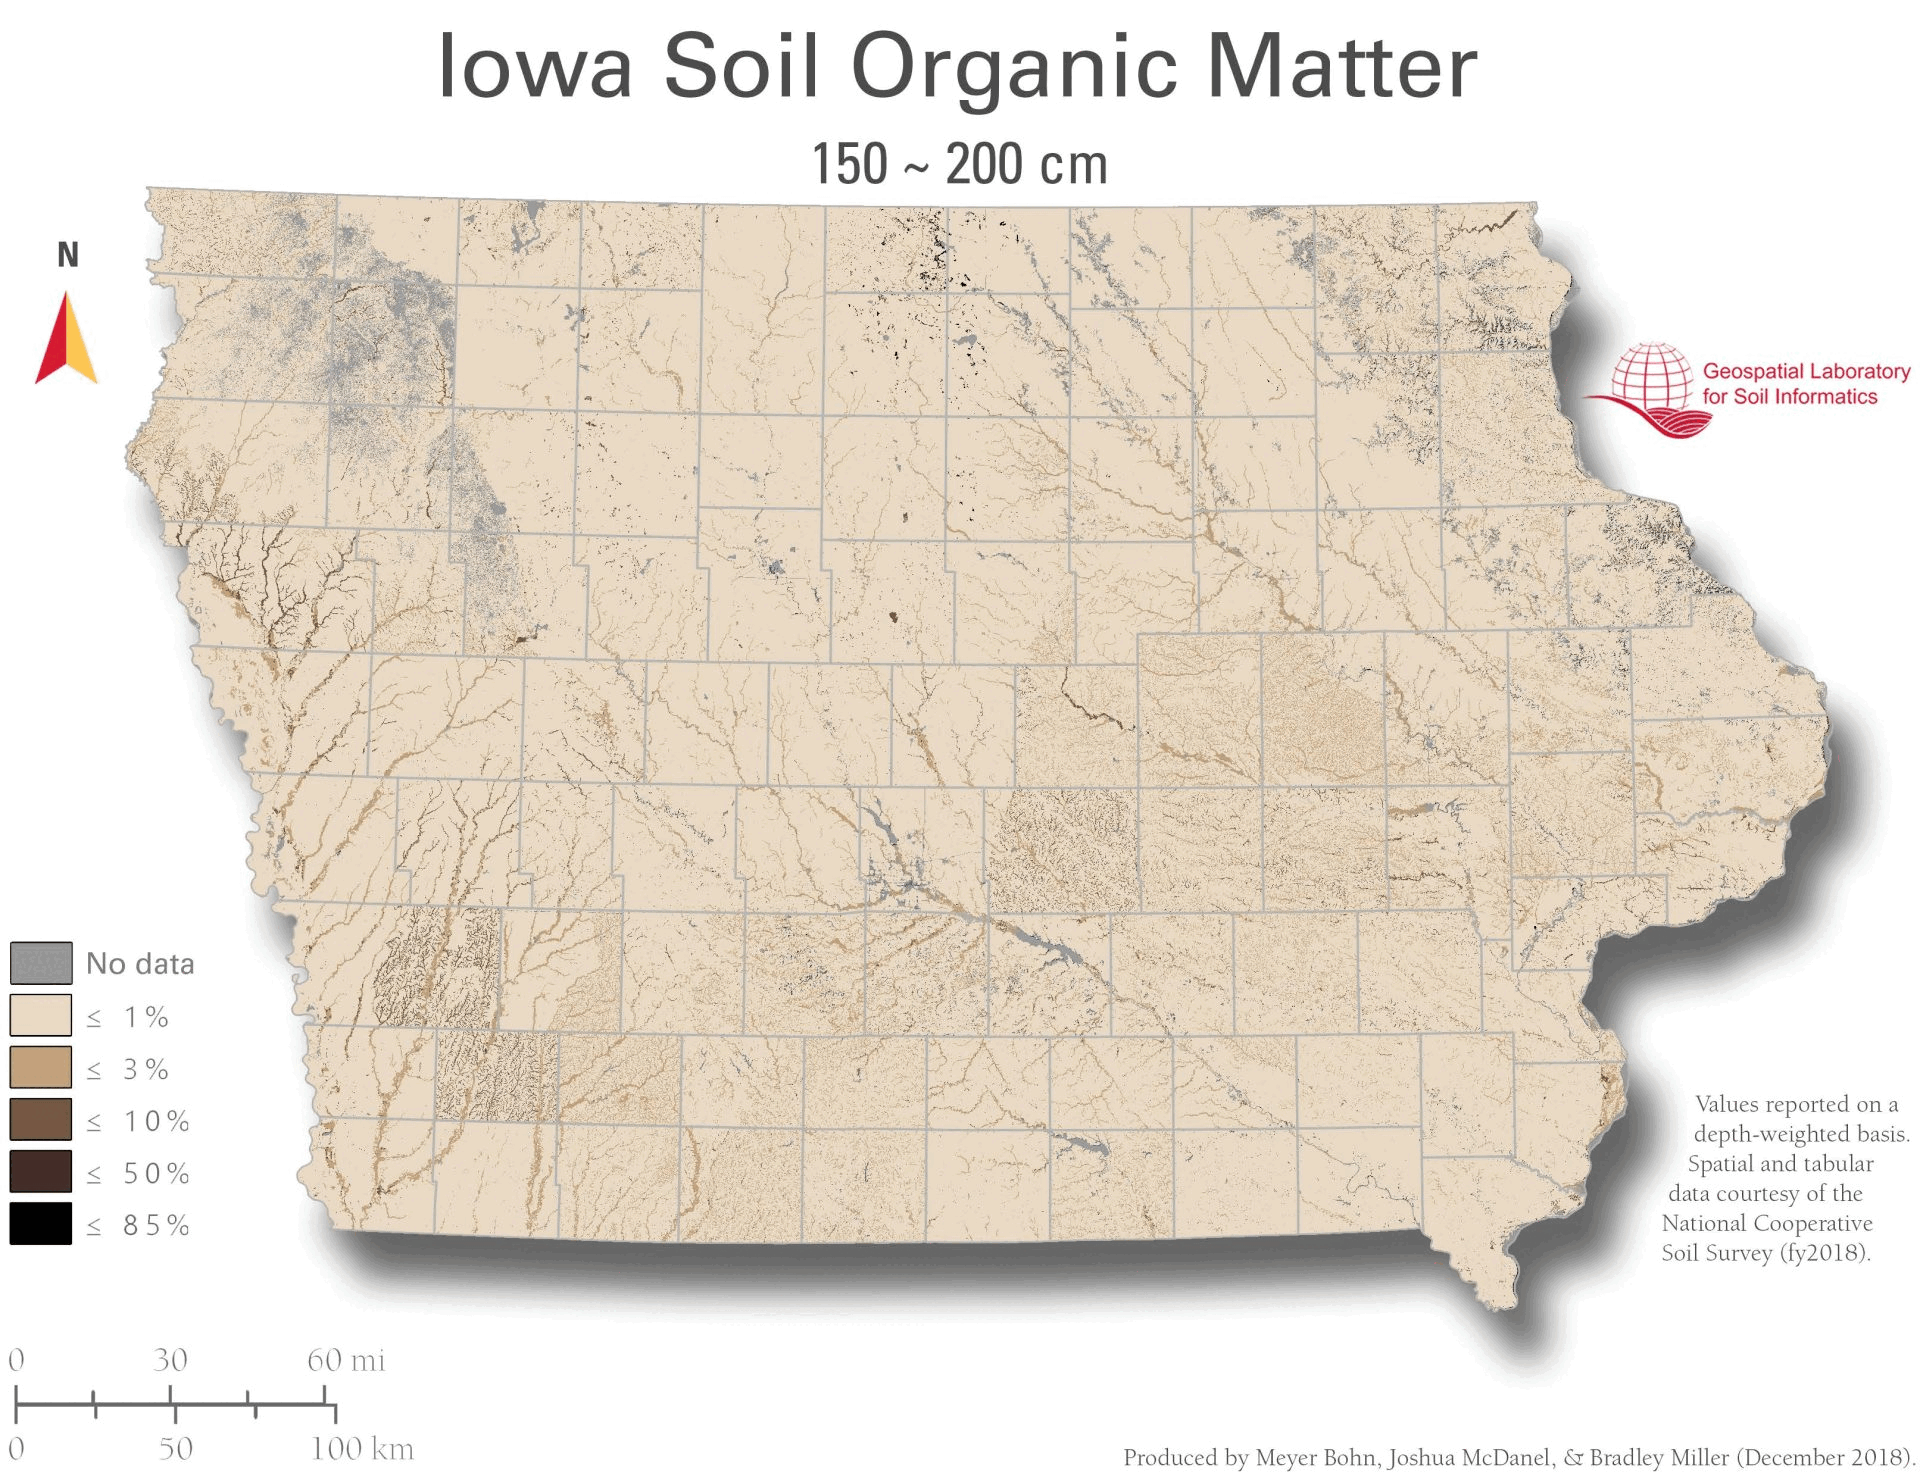
Organic Matter: indicator of fertility, structure, and carbon stocks.
Depth Intervals in Each GIF (Descending Order)
0–5 cm, 5–20 cm, 20–50 cm, 50–100 cm, 100–150 cm, 150–200 cm
(Composite intervals may also appear: 0–20, 0–50, 0–100, 0–200 cm.)