
When can we expect to see reduced levels of nutrients in our water if we make positive changes on the landscape? New Iowa State University research shows how complicated it is to give a sound answer to that question.
The research is featured in a recent article in the peer-reviewed Journal of Environmental Quality, co-authored by Ph.D. student Gerasimos J. Danalatos, Professor Michael Castellano and Associate Professor Sotirios V. Archontoulis, in Iowa State’s Department of Agronomy, and Calvin Wolter, a Geographic Information Systems analyst with the Iowa Department of Natural Resources.
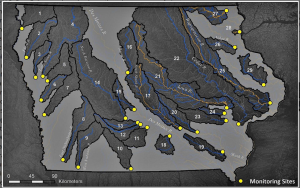
Their study used a modeling approach, combined with water sampling data from 29 Iowa row-crop dominated watersheds monitored since 2001, to estimate the time it will take before the state can reliably identify a 41% reduction in nitrate loss to waterways from nonpoint sources, which originate primarily from agricultural land. The 41% goal reflects the state’s pledge in the Iowa Nutrient Reduction Strategy to reduce nitrate loss to waterways flowing into the Mississippi River, which contributes to the hypoxic dead zone in the Gulf of Mexico.
The researchers found the likelihood of measuring a statistically significant 41% reduction in flow-weighted nitrate concentrations across 15 years could be as high as 96%. That sounds encouraging. However, there was a huge range in the results across the 29 watersheds. The probability of measuring the 41% reduction (should it occur) ranged from about 23% to nearly 100%. The challenge of measuring or observing an actual reduction is primarily due to interannual (year to year) variability in precipitation.
“With that kind of range, it’s really hard to make good predictions and evaluate progress” Castellano said.
Of the water quality metrics evaluated, the researchers concluded that flow-weighted nitrate concentration offered the best opportunity to measure actual reductions in nitrate loss
“Focusing on nitrate concentration or total loss without flow-weighting tells you more about rainfall over time than about nitrate trends due to changes in land use and management” Danalatos said.
To test their ability to measure nitrate changes, the researchers used a novel approach, employing a Monte Carlo simulator, a scenario-generator that can quickly reflect the probabilities of many different situations. They ran more than 5,000 scenarios with the simulator.
In the process, they also examined several non-weather variables they thought could help explain nitrate trends, including land use and farm management changes, and soil organic matter, a measure of soil quality. Some weak relationships showed up between these variables, depending on the size of the watershed. They also looked at differences related to monitoring approaches, such as daily versus monthly sampling. In the end, properties associated with water discharge explained most of the across-watershed variation over time.
“Our results are the first to quantify just how important it is to account for interannual variability in nitrate loss when assessing long-term trends owing to changes in land use and management,” Castellano said.
“Our primary message from the research findings is that the policy-developed timelines we’re using to measure these trends do not align well with our ability to reliably track meaningful water quality changes,” Castellano said. “This is due primarily to the impact of weather. Moreover, if rainfall patterns are becoming more variable, the timeline to measure water quality changes is only going to get longer.”
The researchers emphasize good monitoring data from diverse watersheds over long time periods is critical to draw meaningful conclusions. They also stress that the challenges of measurement identified in this study further emphasize the need to draw on other relevant data when assessing water quality trends, especially land use change and adoption of conservation practices known to reduce nutrient loss.
According to Adam Schnieders, water quality resource coordinator for the Iowa Department of Natural Resources, the agency that funded the study, “The goal of the Iowa Nutrient Reduction Strategy is to achieve a 41% reduction in nitrogen and phosphorus loads leaving the state from nonpoint sources. Seeing this reflected in Iowa’s water quality will be the ultimate measure of success. This work helps us better understand how Iowa’s water monitoring data can be used to track progress toward these goals — and can help inform future efforts to account for the annual variability caused by the weather and other factors identified in this research.”


